
Fix The Node.JS Debugger Not Attaching In Visual Studio Code

Working without a debugger is a totally unnecessary evil these days. Visual Studio Code makes it very easy to enable the integrated Node.JS debugger and use the breakpoints in your code. Sometimes, after a restart of the computer or the Visual Studio Code application to install updates, the Node.JS debugger will not attach anymore. It’s so tedious, especially if it happens in a busy day. Of course, you can be smart and choose not to deploy updates in such a day, but you have little power over your computer just going FUBAR and crashing when you least wanted it.
A few times my VSCode debugger did not attach to the Node.JS processes after a restart of VSCode. I tried intentionally restarting the whole computer as well and did not work. There is a solution for that.
Prologue: Activating the Debugger
If you never activated the Debugger in the first place, this is how to do it.
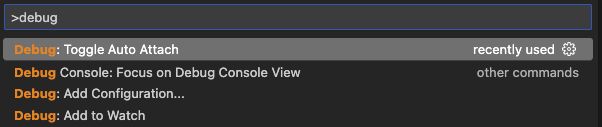
Press Shift-Cmd-P (⇧⌘P) on a Mac or Ctrl-Shift-P on Windows and Linux to bring up the Command Palette. Type “debug”. Select “Debug: Toggle Auto Attach” and press Enter:
A submenu will be displayed:
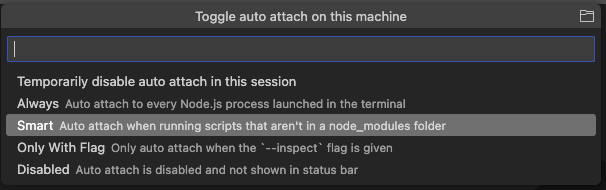
Multiple configurations are offered for the Debugger. “Smart” is a very common and convenient choice. It will automatically attach the Debugger to the processes you start from the integrated Terminal, but leave out any debugging configuration potentially found in the scripts in /node_modules (which are out of the scope of the current application being developed).
If you are not experienced with debugging, just go with “Smart” for now.
What To Do When The Debugger Does Not Attach
If the Debugger is not attaching, the only working solution I found is to:
- Expicitly disable the Auto attach
Bring up the Command Palette as described in the Prologue. Type “debug”. Select “Debug: Toggle Auto Attach” and press
Enter. Select “Disabled” and pressEnter. - Re-enable the Auto attach
Bring up the Command Palette as described in the Prologue. Type “debug”. Select “Debug: Toggle Auto Attach” and press
Enter. Select the same setting you used before (such as: “Smart”) and pressEnter.
Please note that skipping #1 will not work.
Finally, start your application again from the integrated Terminal and the Debugger should attach again.
It feels a bit like the old trusty “turn it off and on” advice that everybody gets every once in a while, but with a twist. Surprisingly, just rebooting VSCode or the computer does not work, at least on Mac.
Please let me know if it worked for you, or you have found a better solution or even found out why this happens in the first place!


