
A real-world example of finding JavaScript performance issues
Why I needed to improve my JavaScript performance
I’m currently working on a simple tool to draw roofs with all kinds of different shapes. The tool should be able to handle all different types of roofs. (I was surprised how many there are) and should perform geometric calculations on all of them (again I was surprised how complex they are). Needless to say that these calculations should work in real-time to ensure the roofs are displayed right.
After I Implemented everything, I’ve ended up with a lot of code that was able to perfectly cover all the requirements. The only problem was it was slow. For every additional shape, the code got slower, making it unusable.

Drawing this kind of roof from my hometown was not possible. The tab froze, and then it crashed because the JS Heap was too big. So there was definitely something that firstly slowed down the app and secondly allocated tons of memory.
So I needed to find an effective way to find this issue.
Three common ways to find performance issues in JavaScript
1. Use Chromes Performance Dev Tools.
Chromes performance dev tools are an amazing way to find performance issues. You can record your app’s behavior during using it and then navigate through your recording to find a slow or blocking code.
There is an incredible article from Google to understand how they work and how you can use performance dev tools to find performance issues within your code.
I was able to find many issues with the chrome performance dev Tools, but I was not able to locate my current Issue with them.
2. Use Console.time
Console.time is a built-in JavaScript tool like console.log.
console.time(tagName);
   console.timeEnd(tagName);
Console time will measure the time the code took to execute between the start and the end call and print it to the console. It also supports nested calls.
Console.time is as powerful as simple to use, that’s exactly what I expect from dev tools.
3. Use performance.measure
performance.measure is similar to the console.time, but in my opinion not that straightforward to use.
With performance.measure you also measure the time between either start and end marks, like with console.time, or you can measure it from the initial page load.
I will describe it in the example taken from the Mozilla documentation.
const markerNameA = "example-marker-a"
const markerNameB = "example-marker-b"
// Run some nested timeouts, and create a PerformanceMark for each.
performance.mark(markerNameA);
setTimeout(function() {
performance.mark(markerNameB);
setTimeout(function() { // Create a variety of measurements.
performance.measure("measure a to b", markerNameA, markerNameB);
performance.measure("measure a to now", markerNameA);
performance.measure("measure from navigation start to b", undefined, markerNameB);
performance.measure("measure from navigation start to now"); // Pull out all of the measurements.
console.log(performance.getEntriesByType("measure")); // Finally, clean up the entries.
performance.clearMarks();
performance.clearMeasures();
}, 1000);
}, 1000);There are two markers created.
The first marker is called outside the timeout and the second inside. When the second timeout callback is entered, the markers will be evaluated into the console.
As you can see there are a bit more options to measure than with console.time, but it is also not as straightforward to use. I assume that for most use cases, you will only be interested in measuring the time a specific function takes to execute. So I will definitely recommend using console.time over performance.meassure to debug your JavaScript performance.
I started using console.time to resolve my issue.
How I found the JavaScript performance issue using console.time
As already described, console.time is like console.log built-in JavaScript functionality, so there is no need to install it.
To use it, simply write:
console.time("marker");
some slow code
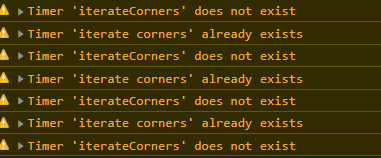
console.timeEnd("marker");If console.time does not work because of a typo or something else, you will see something like this.
If it is working, you will see the time in between each console.time and console.timeEnd call with the given text.
I made an educated guess which code block could cause the performance issue. Then I surrounded this code block with console.time to prove my guess, and as you can see it was right.
I’ve seen that the constructor takes a lot of time, so again I go into it and placed my markers.
I found out that computing the corners nearly took all the time of the object creation. Inside this function, I got a _.cloneDeep where I clone an object to get the x and y coordinated and a method from this object I need to access.
So what are my alternatives to clone Deep?
I’ve used three different methods instead of _.cloneDeep to check which one is the fastest.
I tried _.clonedeep, JSON stringify, and object.assign and compared their performances for my Object. This is my result:
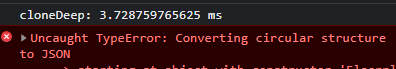
This error is really helpful because it tells us that I wanted to make a clone of a circular structure. This describes the bad performance of cloneDeep for this object.
How does lodash clone Deep work?
To produce a deep clone of an object clone Deep recursively iterates through the object and clones every member of it. That means if the member is an Object itself, it will iterate through this member and clones everything and so on.
This is normally good behavior, but our corner has a member which has stored a list of corners, which means we have a circular structure.
So _.cloneDeep will end up in a loop that describes the bad performance and the evil memory footprint.
What is the alternative to lodash cloneDeep?
The trivial alternative to cloneDeep would be a simple shallow copy of the main object without any members. Leading to much better performance and nearly no memory usage. So always ask yourself: do I really need a deep copy here? Or is a shallow Copy enough. When you just perform read operations on the Object, as I did, a shallow copy is enough, and please do not make a deep copy.
With ES6 you could simply use
...arrayFor Es5 based projects, I like to use
array.slice(0);Which also produces a shallow copy of the array.
I built a direct comparison between these two methods to see the difference.
console.time("cloneDeep");
let cornersslow = _.cloneDeep(this.corners);
console.timeEnd("cloneDeep");
console.time("shallow coppy");
let corners =  this.corners.slice(0);
console.timeEnd("shallow coppy");
Producing this output.
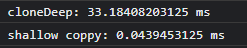
That means that by just going a bit deeper into JavaScript and replacing one line of code, I was able to reduce the average time this method takes by 400 times! (I ran my code about 20 times to estimate this average)
Conclusion
This article was Originally published on my personal blog.
As we have seen above, tiny mistakes could have a huge impact on the code’s performance and memory footprints. This is also what’s so fascinating about performance debugging. You can make huge impacts just by digging deep into your codebase and thinking about programming fundamentals and language features and how to make them work for you.
I hope I could provide you with some value with this article and made you think about how your code works. If you want to support me and the work I'm doing, you can buy me a coffee.
Happy coding performant code,
Alex


