
Feature Engineering For Brain-Computer Interfaces With Code Examples
Forget Time, Think Frequency! A Beginner’s Guide to Brain-Computer Interfaces (part 8)
In previous parts of this series, we dived into various parts of the brain-computer interface (BCI) cycle. We talked about how to collect and stream data from an EEG device, after which we talked about pre-processing (using Common Average Referencing and applying artifact detection. Before we can move on to using machine learning for classification, a common step in traditional pipelines is to apply feature engineering to transform EEG signals in a compact and relevant manner.
The two most common types of features used to represent EEG signals are frequency band power features and timepoint features.
Timepoint features
Timepoint features represent a concatenation of the EEG signals of all electrode channels, for each timepoint. Timepoint features are typically used to classify Event Related Potentials (ERP), which are temporal variations in EEG signals caused by, and directly appearing after, a given event/stimulus [Juck, 2014]. These are the features used in most P300-based BCI, used by keyboard programs for communication. Here, flashes appear over rows or columns. When you think about a certain letter, brain activity increases when the row or column containing your letter is lighted up. An example of a P300-speller is given in Figure 2 below.
However, in this series of blog posts, we focus on BCIs for classifying motor imagery (MI). The golden standard here is to use frequency band filtering. To explain this, we first need to dive into the underlying mechanisms in the brain caused by MI.
Brain signals during motor imagery
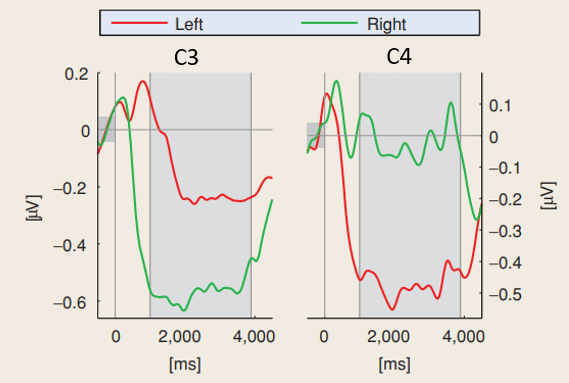
An increase in the power of an EEG signal in a certain frequency band is called an event-related synchronization (ERS), and a decrease of EEG signal power an event-related desynchronization (ERD) [Pfurtscheller et al., 1999]. MI causes ERS or ERDs in different parts of the brain.
For example, right arm MI leads to a contralateral ERD in the motor cortex (right hand MI leads to ERD in the left motor cortex), and to an ERS just after finishing the MI. This phenomenon is illustrated in Figure 2, where the decrease of signal power, an ERD, is clearly visible during the MI task, and immediately after the task, signal power increases, indicating an ERS.
To capture information about the ERD and ERS, we use frequency band filtering.
Frequency band filtering
Frequency band filtering gives features that represent the power (energy) of the EEG data for a given frequency band, over a certain time window. The spectral features capture information of oscillatory activity, such as changes in EEG rhythm amplitudes.
Changes in the signal power during MI is most notable around the 8 to 24Hz frequency band. However, the frequencies with the most notable MI signal differs per subject. In order to broadly capture the relevant EEG signals from MI of all subjects, researchers often design spectral filters for MI-BCIs between 4 and 40Hz.
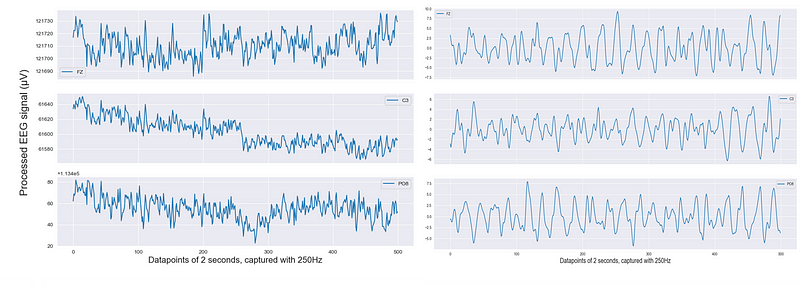
Having our data in a Pandas DataFrame as (timepoints, electrode channels), we can apply a so called Butterworth bandpass filter as follows:
Looking at a segment of 2 seconds, we can clearly see the differences in the signal:
Some extensions for frequency band filtering have been developed as well. Rather than using only one bandpass filter, a filter bank with multiple smaller frequency bands can be applied [Ang et al, 2012]. If one would apply 5 frequency band when the original EEG data has 8 channels, this would essentially create 5x8 = 40 features. Using a filter bank allows later classification algorithms to choose which frequency bands are most discriminative for the specific subject.
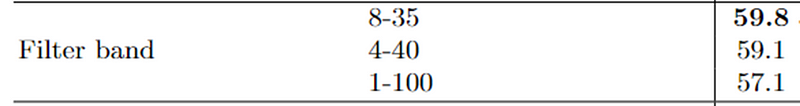
To conclude, I would like to show some results of my project in upper-limb MI classification, comparing a 8–35 Hz, 4–40 Hz and 1–100 Hz bandpass filter to a 1–100 Hz band pass filter using a Riemannian Geometry pipeline (explained in later blog posts). For the subjects in my study, on average the 8–35 Hz performed best, with a 2.7% difference when compared to 1–100 Hz, underlying the argument of using band pass filtering to increase performance of your BCI!
Please check out the publication page, where more practical BCI tutorials like this one will be posted in the future, and give me a follow to be notified for further posts!