FastAPI Microservice Patterns: Health Check API
A basic pattern for service monitoring.
Last update: 2th Sept 2023
Get 30 days of access to the example code of the overall blog post series on GitHub.
Why should I care about?
During development happen errors. When developing micro-services they will probably be unable to handle requests at some point in time. That’s normal. However wasting tons of time recognizing that the overall system is not working properly cause a single service is unable to handle requests should be avoided.
What’s the Health Check API pattern?
The Health Check API pattern is a basic observability pattern for monitoring services. A commonly used imlpementation is that every service in an application implements an /health RESTful API endpoint which can be polled by an monitoring service periodically to determine the service’s health.
As with many other microservice patterns Java’s Spring Boot framework has implemented the pattern with the Spring Actuator API (service endpoint definitions) and Spring Boot Admin (as monitoring service providing an UI) earliest. Of course the usage of the Spring Boot Admin component is optional. But the Actuator API has established itself as a standard which has been adopted widely. E.g. the C# Steeltoe adapted the Actuator API to some degree ( env , health , heapdump , info, loggers, mappings, metrics, prometheus, threaddump) to enable the monitoring of C# microservices with Spring Boot Admin. It’s worth to note that Steeltoe has some endpoints ( hypermedia , httptrace, refresh) which are not part of the Spring Actuator API. Consequently most frameworks implement endpoints for the service as well as nested components (more about that later) conform to the Spring Actuator API: /actuator/health. However you can imagine that a health endpoint is just the tip of the iceberg w.r.t. application observability/monitoring. The Spring Actuator API and Spring Boot Admin allows to implement a lighweight version of a lot of other observability patterns like Log Aggregation, Application metrics, Distributed Tracing and Exception Tracking.
Similar to the C# ecosystem there is motivation to enable the monitoring of Python microservices with Spring Boot Admin. Python is, due to historical reasons, very popular in the artificial intelligence domain for deploying models. However in the common enterprise domain Java’s Spring Boot is adopted heavily partly due to historical reasons as well. The need to integrate artificial intelligence model deployment into enterprise applications lead to the fact that many applications are hybrid w.r.t. the programming languages the services are implemented in. The Spring Boot Admin Reference Guide references Pyctuator, a partial implementation of the Spring Actuator API in Python, in the first section. The implementation of Pyctuator is not that complete than C# Steeltoe’s and of course Spring Boot Actuator’s is. But Python has a huge user base, enables fast development and will probably catch up fast.
Currently Pyctuator implements the following endpoints:
- metrics (memory usage, disk usage, custom metrics) → Spring Actuator API
/actuator/metrics - log file → Spring Actuator API
/actuator/logfile - health (service, MySQL, Redis) → Spring Boot Actuator API
/actuator/health
It’s worth to mention that Pyctuator supports monitoring the health of a MySQL database and Redis as nested components out of the box.
Pyctuator is compatible with FastAPI and other Python web frameworks despite of Django which is not supported (yet) BTW. The project provides a good introductory example for FastAPI as well as an advanced FastAPI example.
Example implementation
The advanced example uses docker-compose (instead of Skaffold) to run containers and poetry run to run the FastAPI service and consists of four components: a FastAPI micro-service, a MySQL database, a Redis in-memory data structure store and Spring Boot Admin monitoring server.
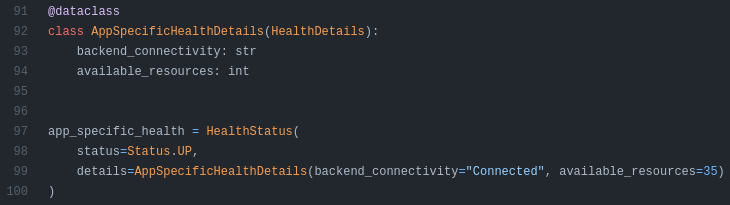
Health check monitoring covers the connection to the MySQL database (pyctuator.register_health_provider(DbHealthProvider(db_engine)) ), the Redis client ( pyctuator.register_health_provider(RedisHealthProvider(redis_client)) ) as well as app specific health conditions (pyctuator.register_health_provider(CustomHealthProvider()) ).
The app specific health is defined as pyctuator.health.health_provider.HealthDetail →AppSpecificHealthDetails(HealthDetails) and injected into a pyctuator.health.health_provider.HealthStatus object instance.
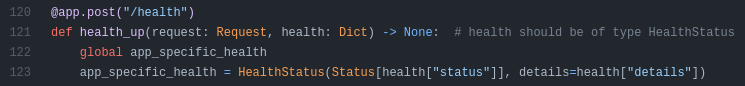
The HealthStatus is mapped to the endpoint /health which is polled by Spring Boot Admin.
On DockerHub there are several community provided Docker images for Spring Boot Admin. Unfortunately there is no officially supported image and there will probably never be one. Therefor the example sticks to an arbitrary, unofficial Docker image michayaak/spring-boot-admin for Spring Boot Admin. For MySQL the example uses an official container image.
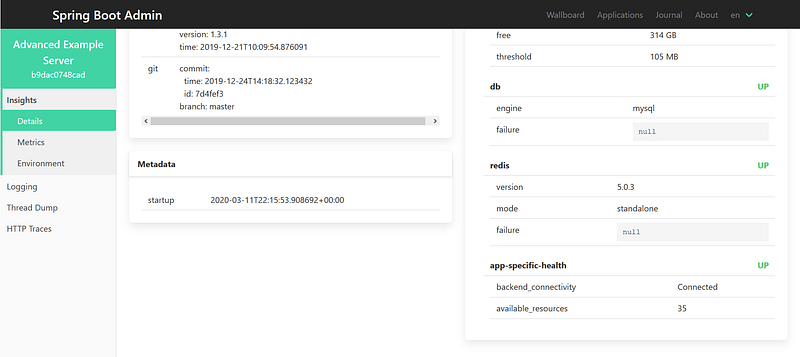
In the Spring Boot Admin dashboard available under localhost:8080 one can observe the health (UP or DOWN) of the database (db), the Redis client (redis) and the app specific health (app-specific-health).