

F1 Score: Don’t Use It For All Imbalanced Data
Benefits and pitfalls of the popular metric
TL;DR at the end
We all had to deal with imbalanced data at some point, where accuracy is not the best metric anymore, and we need something more robust. Should you use the F1 score as a metric instead? Let’s deep dive into where it came from and when it’s the right and wrong choice.
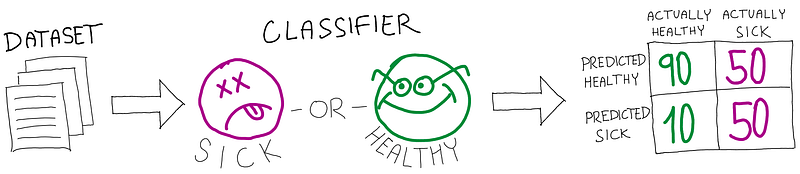
Our job is to create a model to classify if people are healthy or sick. We are given data about them, we’ve created multiple classification models, and it’s time to select the best one.
Precision and Recall
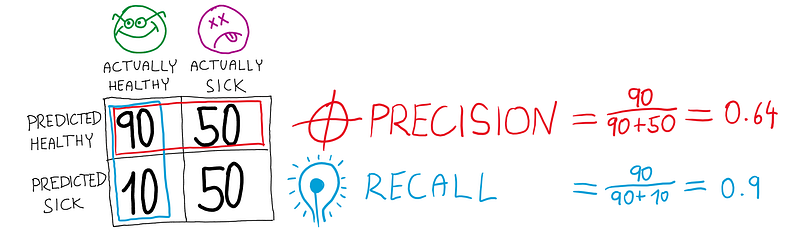
A common way to estimate a model's performance is to measure its precision and recall.
Precision — What portion of all predicted positives are actual positives.
Recall — what portion of all actual positives in our data did we predict correctly.
Precision and recall are great metrics, but they’re still two numbers. If you want to compare two different models to decide which is better, it would be easier to have a single number.
Arithmetic mean
One way to combine precision and recall is just their average (arithmetic mean).
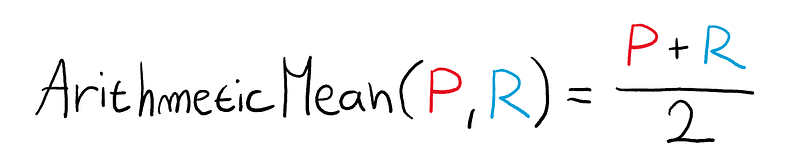
This method effectively combines the two metrics into a single value. However, here’s the catch.
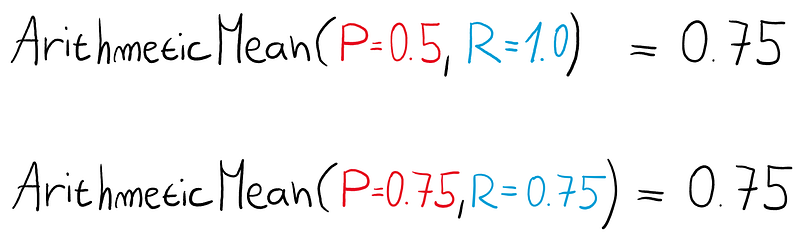
Here, we’ve got the same average. But are the models equally good?
The first model could be just calling everything in our dataset a positive without any logic whatsoever, but the second model looks more useful.
When looking for a good model, we want to avoid the ones with either low precision or recall. These are probably not useful models, and we’d like to lower the “score” if one of the numbers is way smaller than the other.
This is where harmonic mean comes into place.
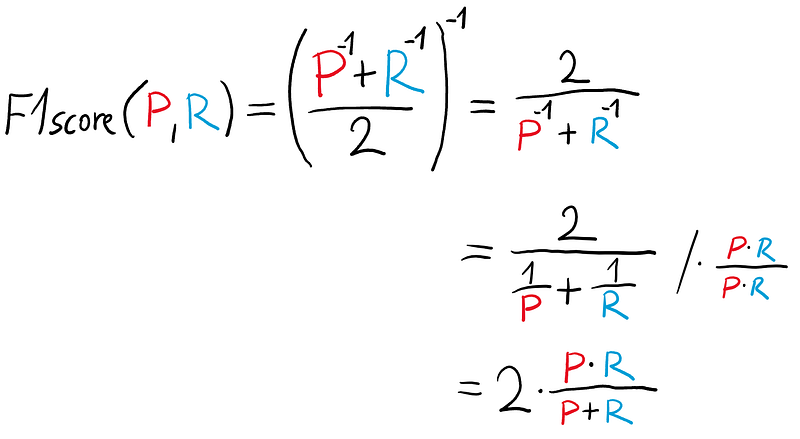
The F1 score is the harmonic mean of Precision and Recall.
Let’s build it together.
Harmonic mean
At the start, we have our normal arithmetic mean.

Now, let’s invert the P and R.

Why? Let’s graph it out.

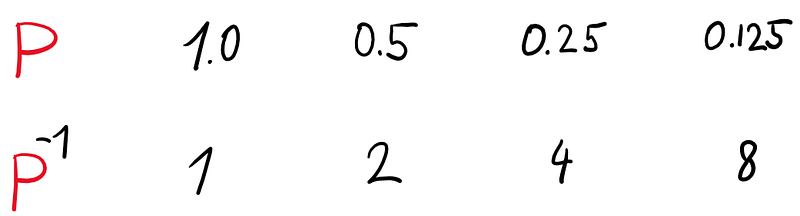
When a number is inverted, the smaller it is, the exponentially larger the inversion becomes. Small precision or recall would result in a large value.
But we want to punish small precision and recall, not reward it. That’s why we will invert the whole equation, effectively flipping the numerator and denominator.
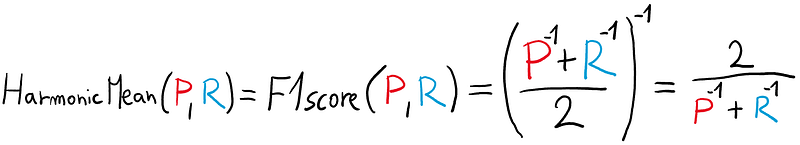
This will cause lower and lower precision/recall to exponentially increase the denominator, making the result exponentially smaller.
Let’s freeze precision at 1.0 and see what happens when recall changes.
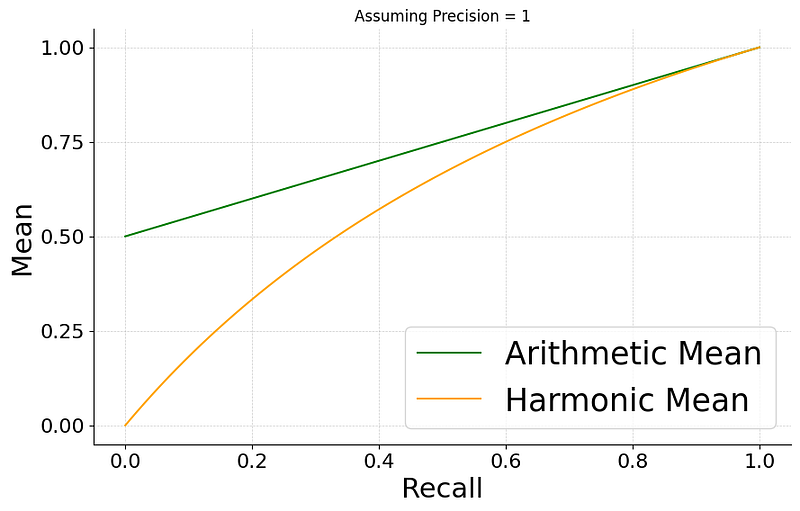
If we achieve a recall of 1.0, then the harmonic mean is simply 1 (the maximum). Once the recall starts decreasing, we start losing points exponentially. The same would be true if precision decreases.
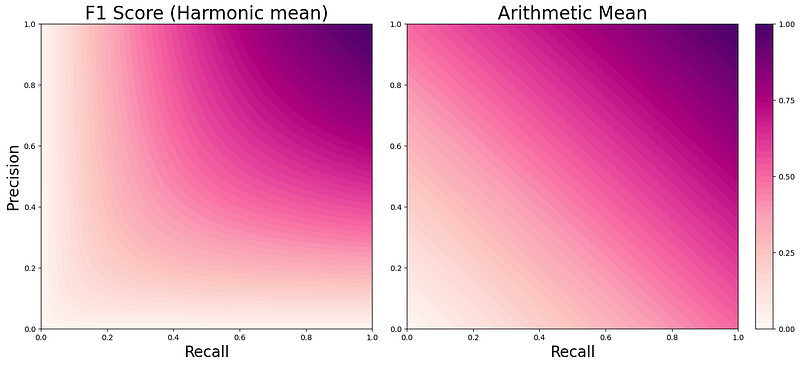
One interesting property arises — Harmonic mean is always smaller than the arithmetic mean (except when both Precision and Recall are equal, then it’s the same).
We can look at it as a more pessimistic average of precision and recall, giving us a better metric to judge the model’s usefulness.
Another way to look at F1 score is as a score that will ‘cling’ to the lower of the two values.
That’s it!
F1 score simply averages up precision and recall in a way that exponentially punishes small values of either of them.
You made it. Here’s a puffin named Bob as a reward.

Some interesting facts about F1 score
The equation
You may have seen a different equation for the F1 score. It is equivalent to the one above.
F1 score will not save you from imbalanced data.
Let’s consider differently balanced datasets.
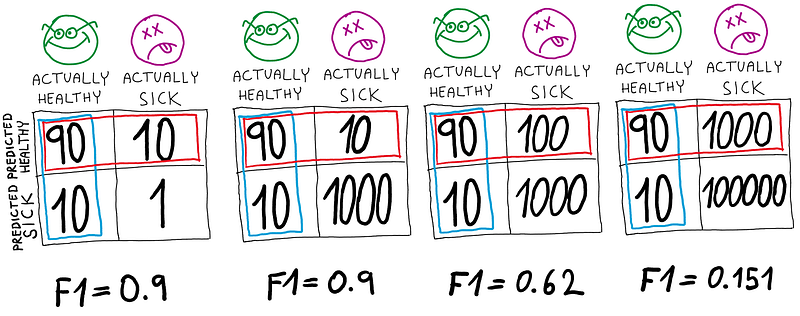
- Case 1 — Our data has more positives than negatives, and we got a great F1 score even though we are absolutely horrible at detecting negatives. This is not a good model.
- Case 2 — We have more negatives in our data. We still get a high F1 score, but it is supported by good performance on negatives.
- Case 3 — We have more negatives but worse overall performance than case 2, so the F1 score drops. This is desirable.
- Case 4 — We have EVEN more negatives and are pretty good at detecting them. However, our F1 score is super low, even though we misclassified only 1% of them. This is desirable when our positives are people without covid, and we really care about not letting anyone sick through.
Overall, the F1 score is a good choice if your positive class is the minority class or the data is balanced. In that case, if your F1 score is high, the model is likely good (Case 2). However, if it’s low, it doesn’t necessarily mean the model is bad (Case 4).
It is not a good choice if your positive class is the majority of your data (Case 1).
When using the F1 score, you should always consider your data distribution and the use case of the model.
Symmetry
The F1 score is computed from precision and recall, which are metrics computed for the positive class. If you swapped the negative and positive labels in your dataset, your precision and recall — and subsequently F1 score — would be different!
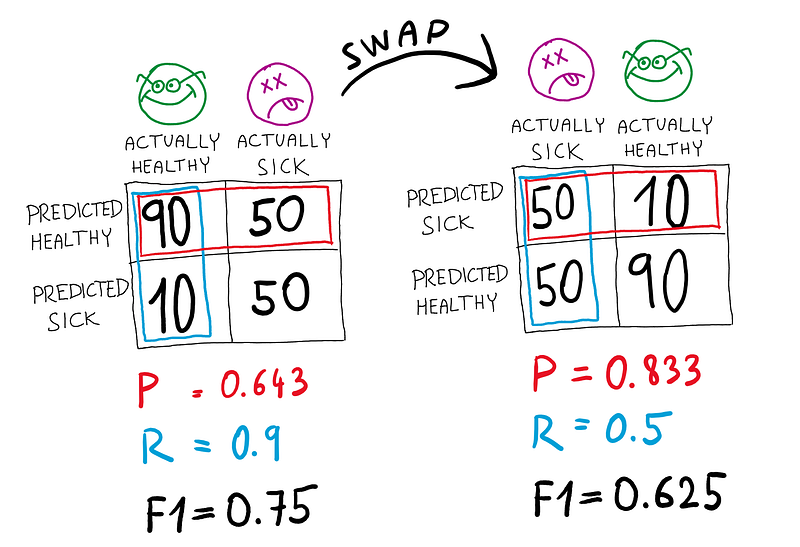
F1 score is not symmetric, and if you care more about negative predictions, consider using them for computing the F1 score instead.
Multiple classes
F1 score is always computed for one class — for binary classification, we usually pick the positive class.
We can also compute the F1 score for a classification dataset with many classes. Then, we would need to pick a class in the style of one-vs-the-rest and compute the F1 score for that class.
This leaves us with an F1 score for each class. To aggregate these into a simple number, you can use different methods like macro, micro, and weighted averaging.
Informational value
F1 score is a great metric to judge a model performance in a quickly dissectable single number that we can easily compare across models. However, we always get more information from looking at Precision and Recall separately and even more information from a complete Confusion matrix.

Conclusion/TL;DR
- The F1 score is a metric showing how good a classification model is.
- It combines Precision and Recall and clings closer to the lower of the two, emphasizing the need for a balance between them.
- The F1 score should be evaluated on a dataset where the positive class isn’t the majority.
- It’s a great way to use a single number to compare and pick models when used correctly.


