
Exploring Anomaly Detection with ChatGPT: Part 1 of 3

Introduction:
Let’s dive into a fascinating world where technology meets data science. With OpenAI’s ChatGPT, we’ve got a new tool in our hands, much like a clever gadget for data lovers. I’ve been exploring this tool, especially focusing on how it can help us spot unusual patterns in time-series data, like ECG readings.
NOTE: all code blocks can be found at the following Colab Notebook: https://colab.research.google.com/drive/18vKK6U8LvvjQ_wFjnAFqdXkR9oL2jv6j?usp=sharing
What’s This About Anomalies?
Remember when we looked at ECG data with TensorFlow? Now we’re taking a step further. We’re testing out a model similar to GPT to see if it can do the same thing — telling apart normal and abnormal heart readings using AI.
Why Use a GPT-like Model?
We’ve been using VAEs for this kind of work, and they’re great. But it’s exciting to try something new, like a GPT-like model. We’re exploring this to see if it’s a good idea, not just because we can.
Understanding ChatGPT’s Mechanics:
ChatGPT works using a special method that focuses on different parts of data. It’s like having a smart assistant that knows what to look at and how to interpret it. For those interested in the nitty-gritty, Karpathy’s nanoGPT video is a great resource that explains this further. https://www.youtube.com/watch?v=kCc8FmEb1nY&themeRefresh=1
VAE and GPT: How Do They Differ?
Think of VAEs like artists who reshape data and then try to recreate it. If the recreation is off, it might signal something unusual. GPT models, however, are like detectives trying to guess what comes next in a data sequence. We’re seeing if training them on normal data helps them spot when something doesn’t follow the pattern.
Keeping It Simple:
In this article, we’re looking at AI in a new light — using it to find odd patterns in data. It’s a mix of technology, curiosity, and smart computing. Stay with us as we explore how AI is not just about understanding data but also about uncovering the hidden stories within it.
Data Preparation: Easy as Pie
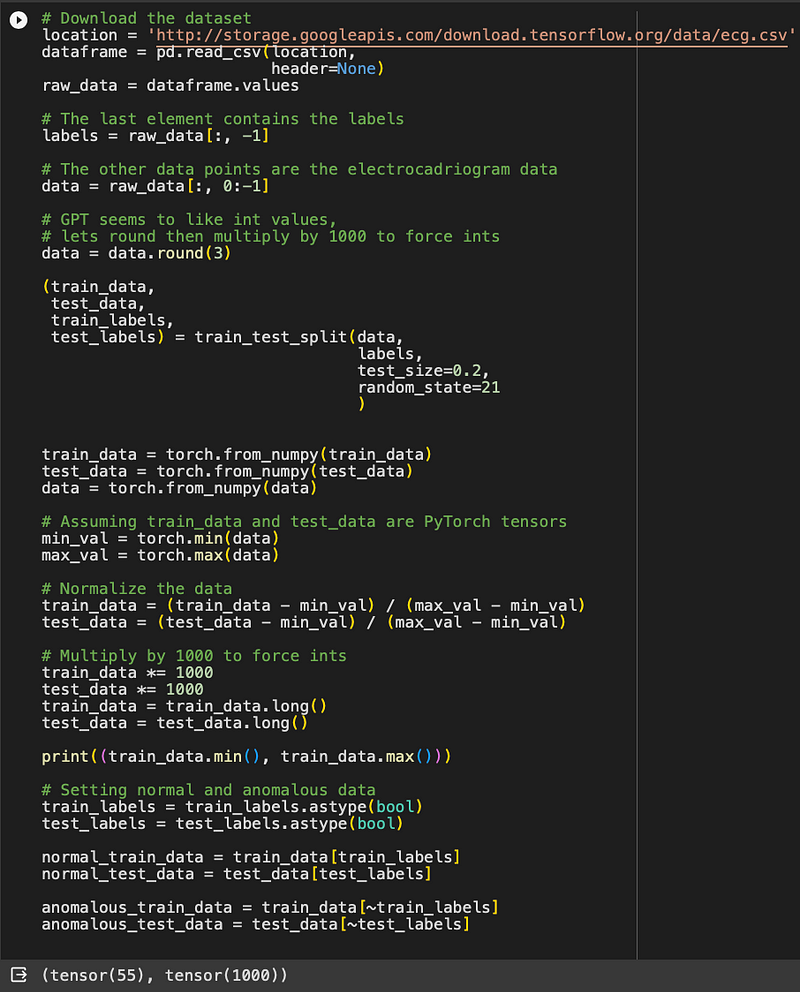
Think of loading our ECG data like opening a spreadsheet in pandas — it’s that straightforward. We then split this data into two parts using scikit-learn: one part for training our model and the other for testing it. We’re looking at both regular heart readings and the unusual ones.
Now, here’s a little twist. Normally, we’d just adjust our data based on the training part to keep things consistent. But we found a little hiccup with that approach — it caused errors in our model. So, we’re trying something different: we’re adjusting all our data in the same way, a method called global normalization. It’s like making sure our model doesn’t get surprised by anything new or out of the ordinary.
Training and Testing: Like Comparing Photos
We use the same scikit-learn magic to get our model ready. It’s like preparing for an exam — we train with one set of data and then test with another. And to make things more interesting, we’ll show you what normal and unusual heart readings look like — think of it as before-and-after pictures in a makeover show.

Building the Network: A Blueprint for Success
Setting up our network is like following a recipe from a master chef, inspired by Karpathy’s GPT method. If you’re curious about the technical nitty-gritty, Karpathy’s video is a gold mine of information.
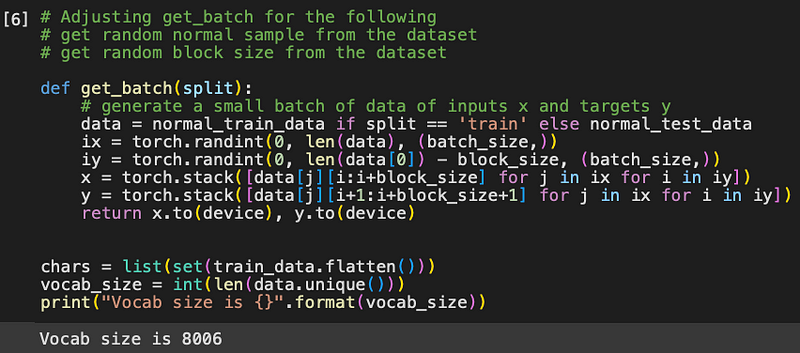
Batch Generation: Mixing It Up
Our method for preparing batches of data is a bit unique. While Karpathy used a single, straightforward text source, we’re juggling multiple ECG readings. So, we pick an ECG at random and then neatly arrange our data to fit the model’s needs. It’s a bit like a chef selecting the perfect ingredients for a dish.
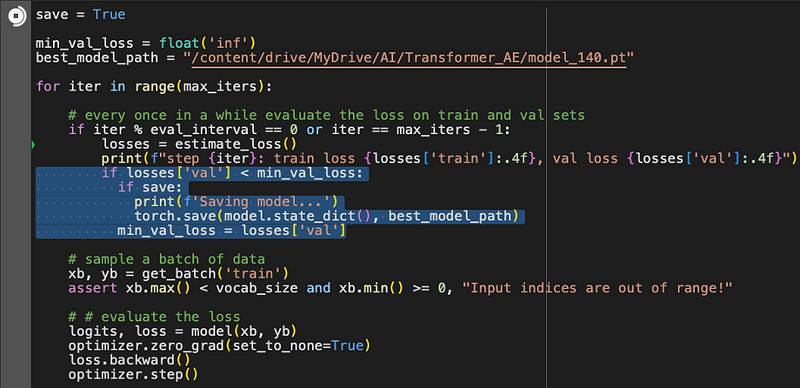
Training Loop: A Pat on the Back
In our training loop, we’ve got something neat: whenever our model gets better than before, it saves that progress. It’s like we’re telling the model, “Good job! Let’s keep this improvement.”
Making Predictions: A Waiting Game
These predictions do the following:
1. Take an input sequence of the first 64 data points within the signal
2. Try to predict the rest of the 140 data points
3. Find the mean squared error between the ground truth data and the predicted data
4. This value can be called the train loss
Now, when it comes to making predictions, our model takes its time — almost an hour! While this might not be ideal for quick use, it’s still interesting to see how it performs.
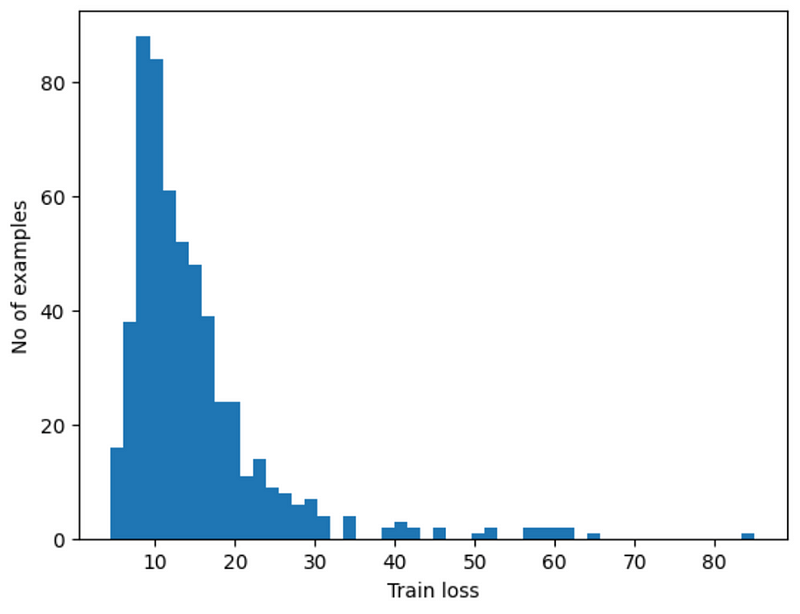
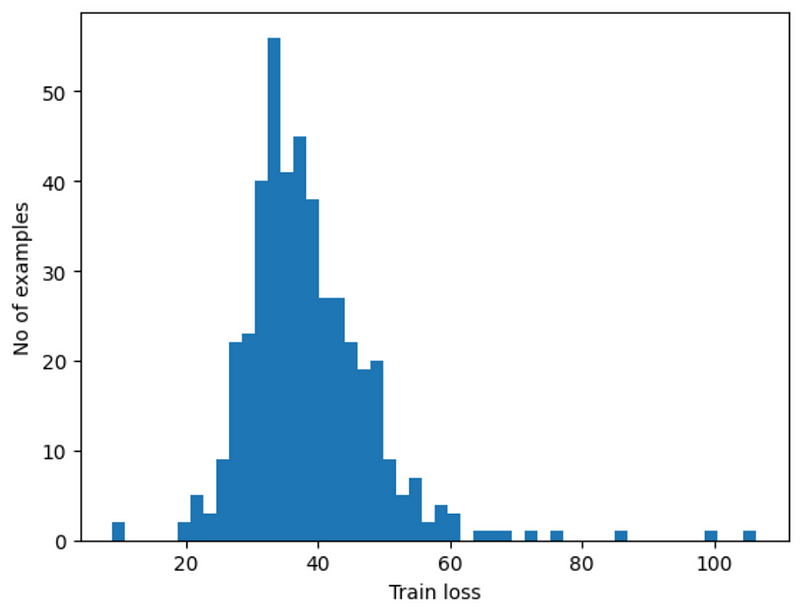
Results: How Did We Do?
So, how did our model do? When looking at normal heart readings, it usually hit around the number 12. But for the unusual readings, it was more around 35. By setting a sort of ‘middle ground’ at 20, we checked how accurate, precise, and reliable our model was. The numbers we got were pretty good — 90.3% accurate, 83% precision, and 99% recall. This means we are good at detecting anomalies, yet we get a decent amount of false positive cases in the normal test ECG dataset.
Wrapping Up: Key Takeaways and Looking Ahead
Here’s what we learned:
1. This method really makes the computer work hard, more so than the VAE method we used before.
2. The results weren’t as good as with the VAE method.
3. The outcome varied based on how much data we started with.
But the exciting part? It shows that a GPT-like setup can actually learn to spot these anomalies. In my upcoming articles, I plan to dive into tweaking this setup to make it faster and more accurate. Stay tuned for more insights!