
Exploratory Data Analysis (EDA) On Olist Dataset
Exploratory Data Analysis (EDA) On Olist Dataset (Brazilian E-Commerce Dataset)
This Article Includes:
1. Data Overview
2. Data Description
3. Reading Data(.csv)
4. Data Cleaning
   * Handling missing values
   * Data Deduplication
5. High Level Statistics
6. Univariate Analysis
7. Bivariate Analysis
8. Multivariate Analysis
9. RFM Analysis
10. Conclusion
1. Data Overview
Source:- https://www.kaggle.com/olistbr/brazilian-ecommerce
Uploaded In the Year : 2018
provided by : Olist Store
The data is divided into multiple datasets for better understanding and organization.
Data is available in 9 csv files:
1. olist_customers_dataset.csv (data)
2. olist_geolocation_dataset.csv(geo_data)
3. olist_order_items_dataset.csv(order_itemdata)
4. olist_order_payments_dataset.csv(pay_data)
5. olist_order_reviews_dataset.csv(rev_data)
6. olist_orders_dataset.csv(orders)
7. olist_products_dataset.csv(order_prddata)
8. olist_sellers_dataset.csv(order_selldata)
9. product_category_name_translation.csv(order_prd_catdata)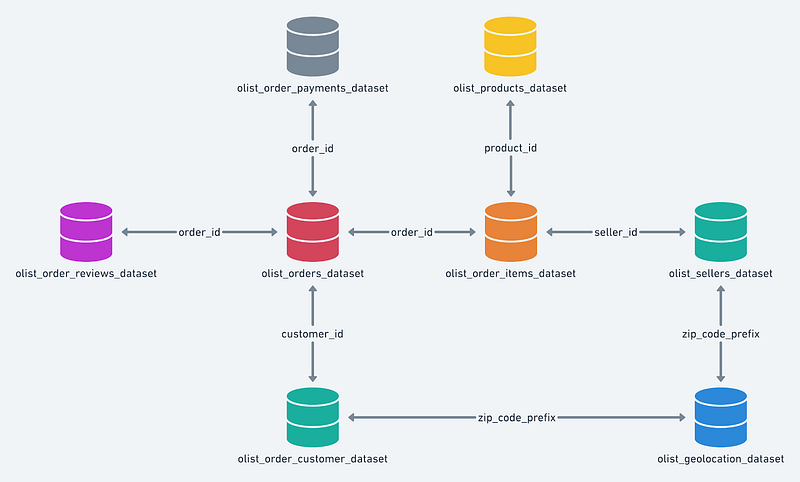
- The olist_orders_dataset has the order data for each purchase connected with other data using order_id and customer_id.
- The olist_order_reviews_dataset has the labelled review data for each order in the order data table labelled as [1,2,3,4,5] where 5 being the highest and 1 being the lowest.
- We will use reviews greater than 3 as positive and less than equal to 3 as negative reviews.
- The data will be merged accordingly to get the final data needed for the analysis, feature selection, and model training.
2. Data Description
Description About all columns/features are shown below:
3. Reading Data(.CSV)
The first step that I followed is to read all the .csv files as mentioned in the data overview part:
After Reading these files I observed the number of columns and rows with the columns name of each .csv files along with this I also checked the dtypes for each file separately.
Checking Number of Columns, Column Names and Number of rows:
Checking dtypes
4. Data Cleaning
- Handling missing values
The merged final data have many null values. The maximum number of null values are present in the column review_comment_message which is of object dtype.Columns like order_approved_at , order_delivered_carrier_date and order_delivered_customer_date are also, have null values. These missing values are either replaced and dropped. The codes are shown below.
- Data Deduplication
As you can observe the duplicate rows like the row with order_id 82bce245b1c9148f8d19a55b9ff70644 all the columns are the same. we can drop these rows keeping the first.
5. High label Statistics
The final data after merging, cleaning, and deduplication has the following features -
The merged data has 32 columns and it has categorical features like order_status,payment_type, customer_state, and product_ category _name_english. One column named review_comment_message has text data that is in Portuguese. There are few numerical features also. The description of the numerical features are shown below-
We can observe from the above table that-
- For the price and freight value of an order. The maximum price of an order is 6735 while the max freight is around 410 Brazilian real. The average price of an order is around 125 Brazilian real and freight value is around 20 Brazilian real. The order with a minimum price of 0.85 Brazilian real has been made.
- For payment_value, the maximum payment value of an order is 13664 Brazilian real. Also, We can observe the statistics like percentile values, mean and standard deviation values, count, min, and a max of other numerical features.
Correlation Matrix-

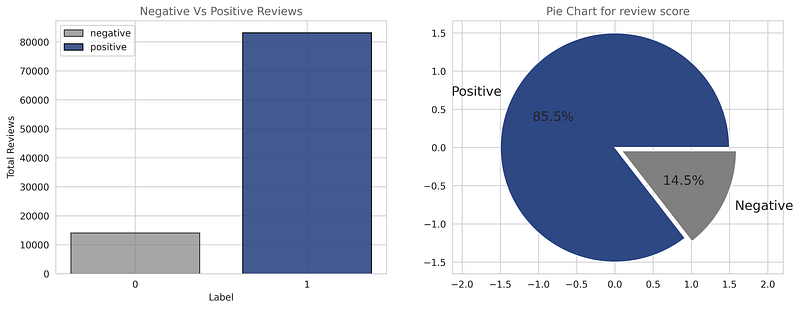
Now let us observe the target variable i.e review score, the scores greater than or equal to 3 are considered as 1(positive) and otherwise 0(negative). From the distribution of the target variable, we can observe 85.5% of the total reviews are positive and 14.5% are negative. From this, we can conclude that the given dataset is skewed or imbalanced.
6. Univariate Analysis
In this eCommerce dataset, there are mainly four types of payment methods are used these are credit card, baleto, voucher, and debit card.
Note: Baleto ==> Boleto Bancário, simply referred to as Boleto (English: Ticket) is a payment method in Brazil regulated by FEBRABAN, short for Brazilian Federation of Banks.It can be paid at ATMs, branch facilities and internet banking of any Bank, Post Office, Lottery Agent and some supermarkets until its due date.
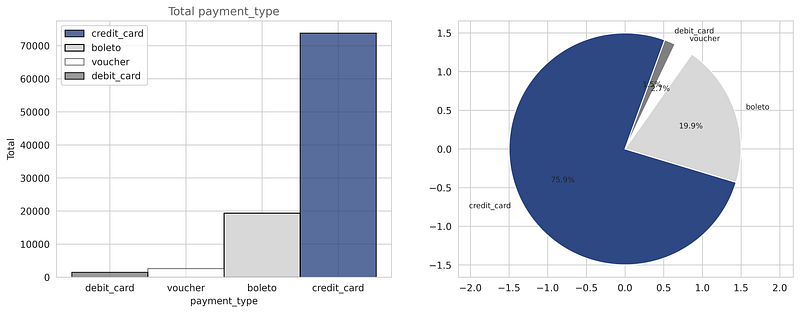
- from the above plots, we can observe that most of the orders are paid using a credit card and the second most used payment method is boleto.
- The percentage of each mode of payment is shown in the pie chart which shows amongst all payments made by the user the credit card is used by 75.9% of the users, baleto is used by 19.9% of the user and 3.2% of the user used voucher and debit card.
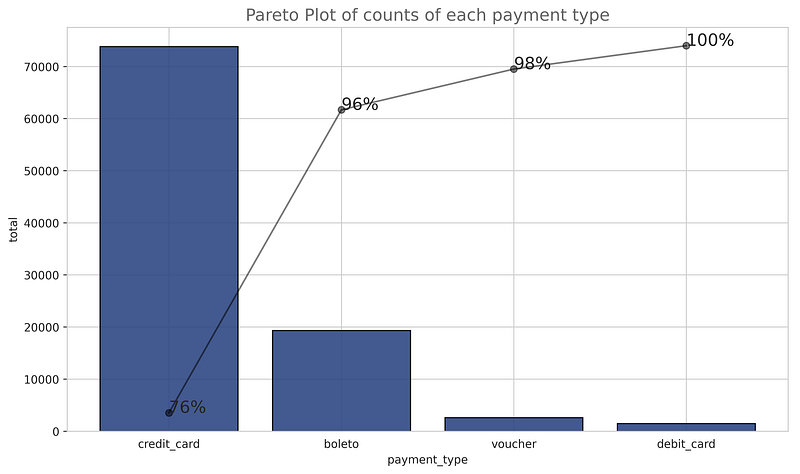
We can observe from the above Pareto plot also that 96% of the customers had used a credit card and baleto. lets us see how this feature is related to our target variable.
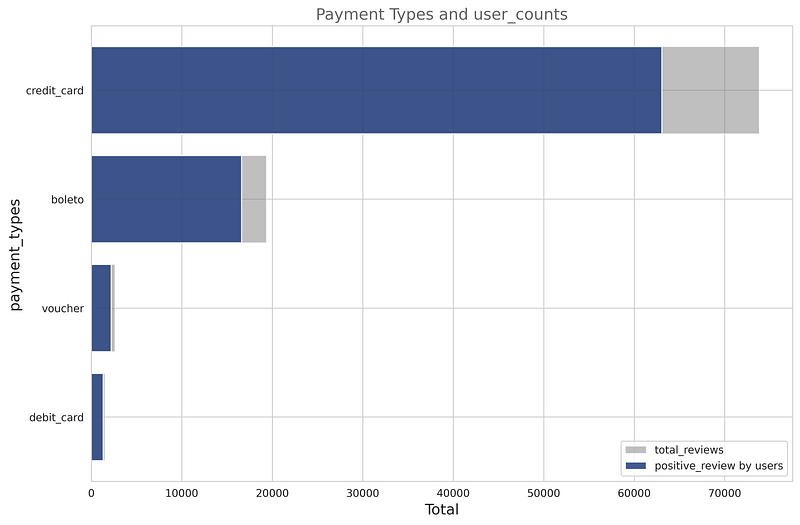
We can observe from the above-stacked plot that most of the customers who used credit cards have given positive reviews. Also, for the boleto, voucher, and debit card users, it is the same. From this, we can conclude that this can be our important categorical feature for the problem.
Now let’s do a univariate analysis on the column customer_state. This column contains state codes for the corresponding customer_id. The name of the states and the state codes are shown below on the map of Brazil.
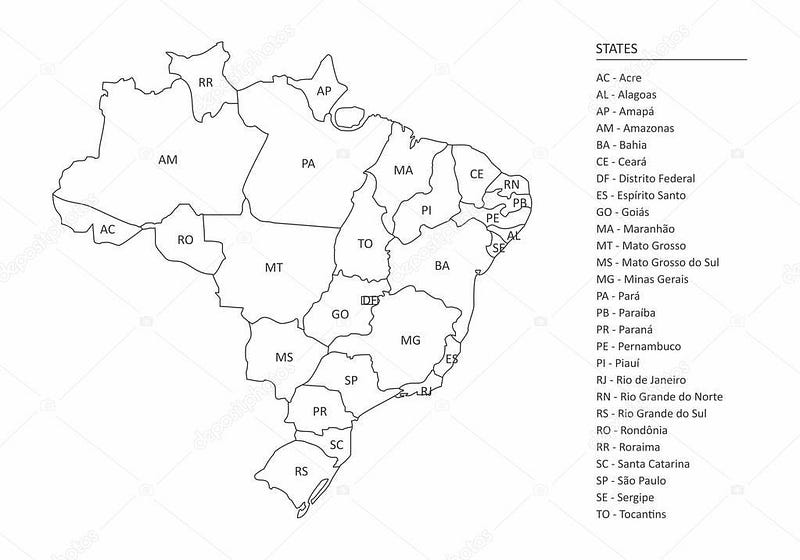
Map of Brazil, Image source[ https://st4.depositphotos.com/1374738/23094/v/950/depositphotos_230940566-stock-illustration-map-brazil-divisions-states.jpg ]
The top three populous states of Brazil are São Paulo, Minas Gerais, and Rio de Janeiro and we can also observe from the plot shown below that 66.6 % of the orders are received from these states which mean most of the customers are from these states.
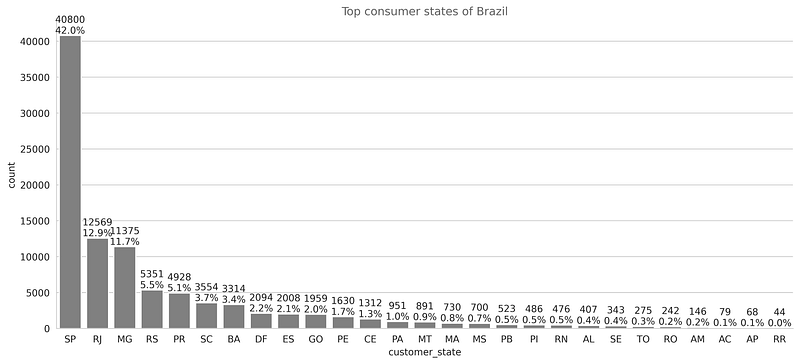
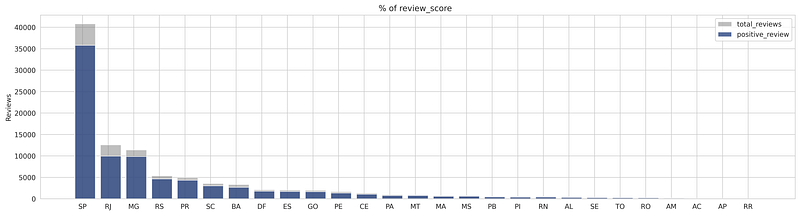
Also from the stack plot of reviews per state shown below, we can conclude that most consumers from each state have given positive reviews. In SP state from the total reviews of 40800, 35791 reviews are positive and for RJ state 9968 reviews are positive from the total reviews 12569. The consumer_state can be our important feature for the problem.
As we know product categories are one of the important features in this business to know the top-selling product categories I plotted a bar graph shown below-
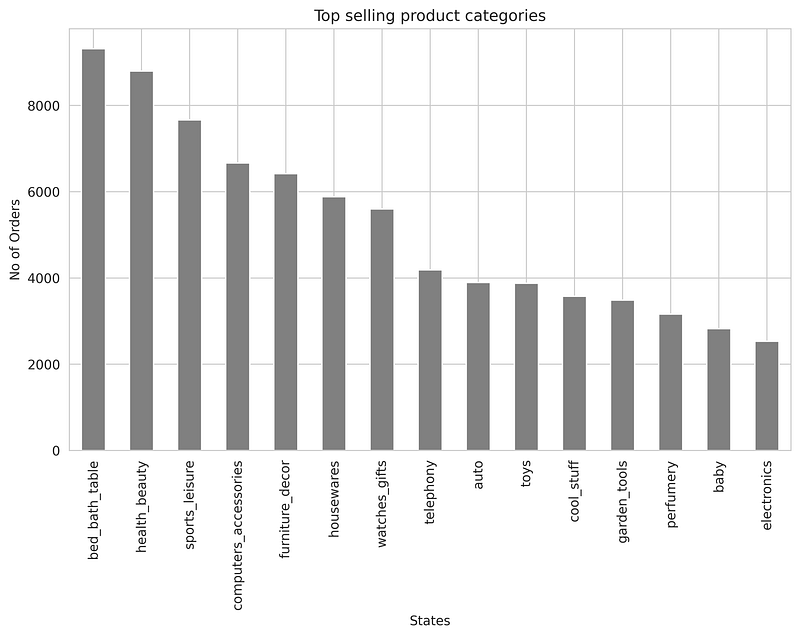
As we can observe, the most ordered products are from the bed_bath_table category, health beauty, and sports_leisure between 2016 and 2018.
There are few timestamp features also in this dataset like order_purchase_timestamp ,order_purchase_timestamp ,order_approved_at ,order_delivered_customer_date ,order_estimated_delivery_date e.t.c. I did a univariate analysis on the timestamps after extracting attributes like a month, year, day, day of week e.t.c. The data given is of 699 days and the timestamp between which data is collected is 2016–10–04 09:43:32 -2018–09–03 17:40:06 .
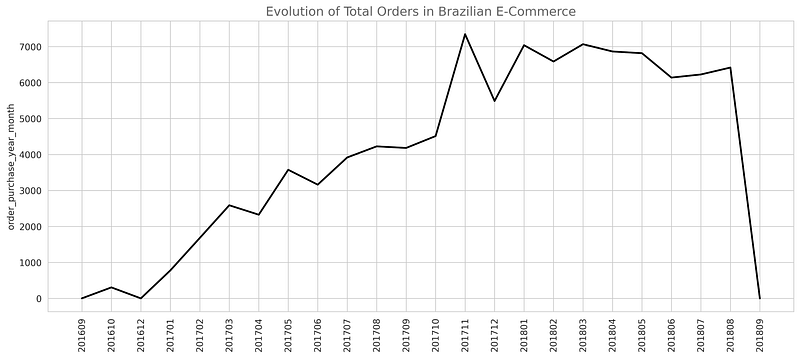
The evolution of the total orders received is shown above, the maximum number of orders are received in 201711. Also, we can observe the growth of Olist from 201609 to 201808.The analysis of the orders and reviews based on the attributes extracted from order_purchase_timestamp has been concluded.
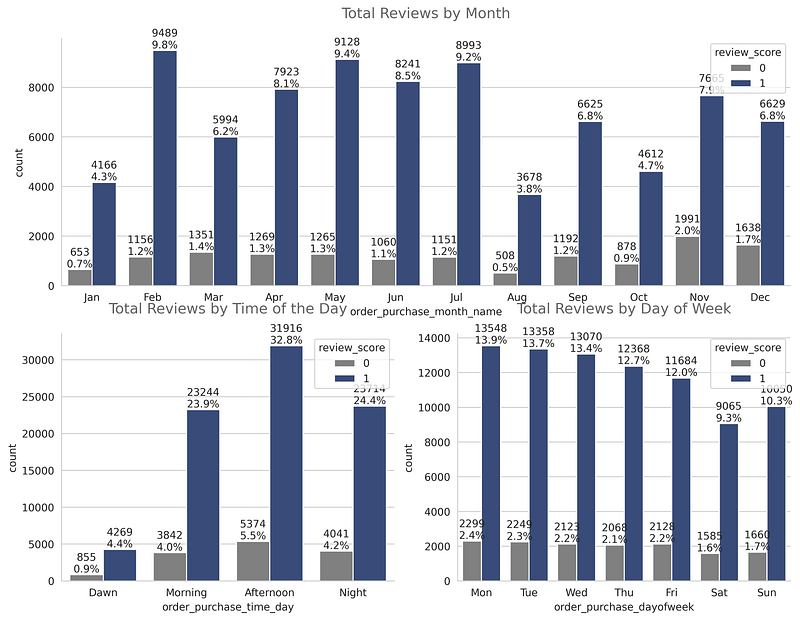
- From the subplot titled Total Reviews by Month, we can observe that the highest % of positive reviews amongst the total reviews between 2016 to 2018 are given Feb i.e 9.8%.In May and July amongst the total reviews, there are more than 9.0% of reviews are positive.
- From the second subplot titled Total Reviews by Time of the day, we can conclude that a maximum number of orders are received in the afternoon and the highest % of positive reviews are given at that time i.e 32.8%.
- From the third subplot titled Total Reviews by day of the week, we can conclude that a maximum number of orders are received on Monday and the highest % of positive reviews are given on that day and Tuesday i.e 13.9%.
Univariate Analysis on numerical features-
- Distribution of product price per class
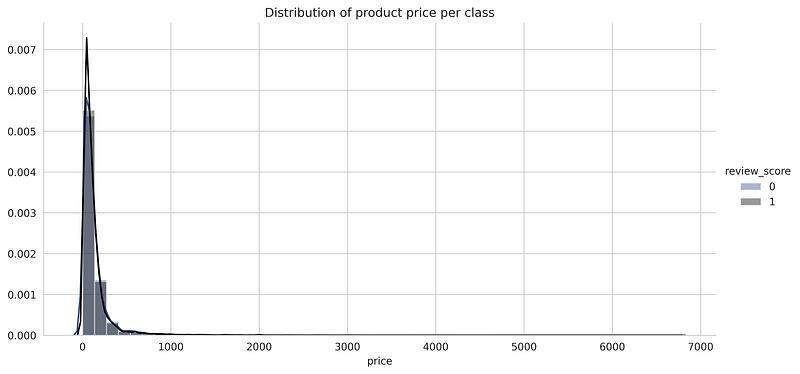
Image by Paritosh Mahto
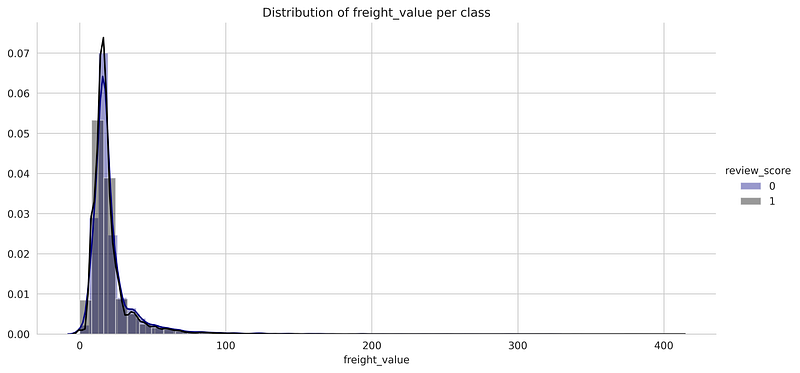
- Distribution of frieght_value per class
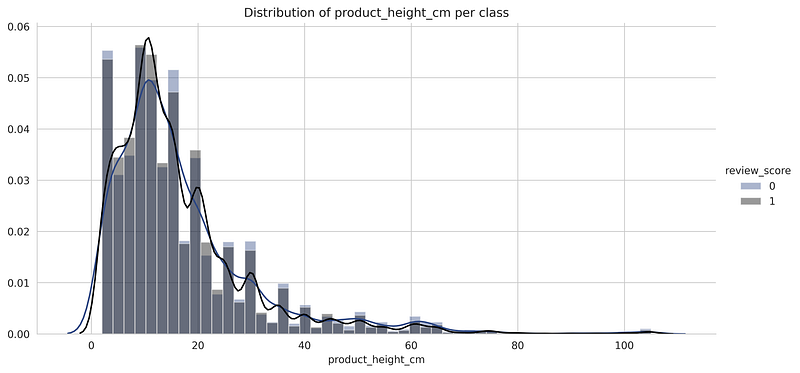
- Distribution of product_height per class
- Distribution of product_weight_g per class
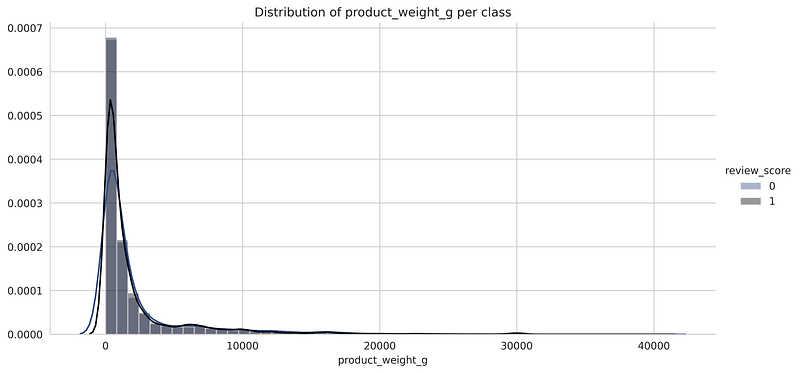
- The above distribution plots show the distribution of each numerical feature for both the positive and negative classes. We can observe that there is an almost complete overlap of both the distribution for the positive and negative classes which suggests that it is not possible to classify them based only on these features.
7. Bivariate Analysis
There are more than 10 numerical features in this dataset but from the correlation matrix shown above, we can observe most of the features are cont linearly related. For bivariate analysis, only four features are selected and plotted in a scatter plot.
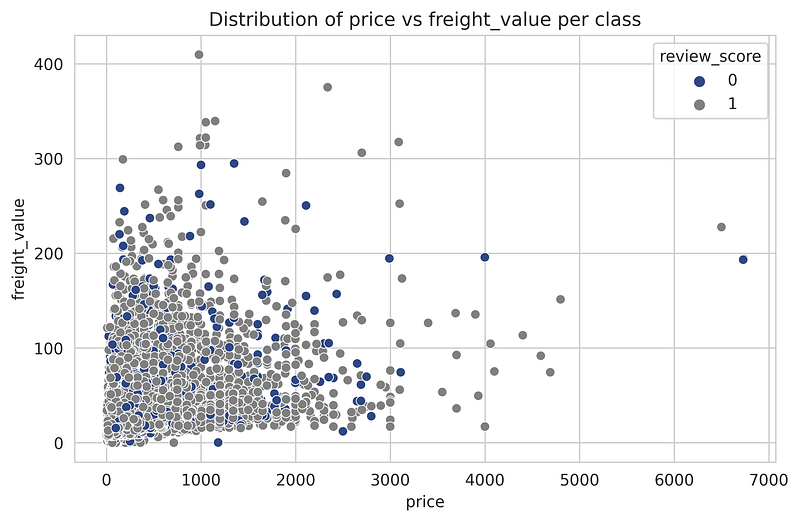
- From the two scatter plots titled
Distribution of price vs freight_value per classandDistribution of price vs freight_value per classrespectively, we can observe It is very hard to say anything about the reviews based on these plots as data points are not separable based on reviews these are completely mixed data. - Distribution of price vs freight_value per class
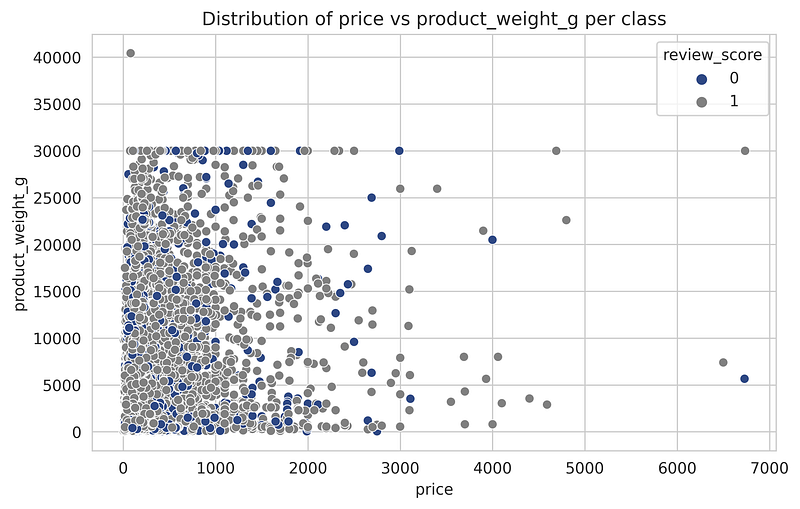
- Distribution of price vs product_weight_g per class
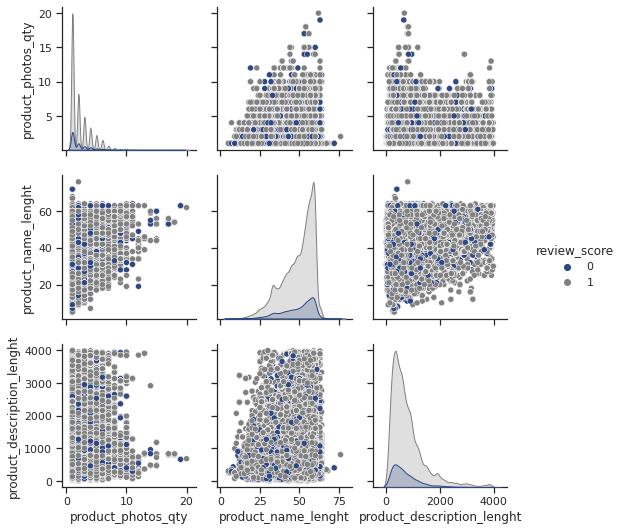
- Pair Plots
A pair plot is plotted shown below for the features product_photos_qty, product_name_length,product_description_length as these have negative correlation values with the review_score column. All the scatter plots between the features are completely mixed up not separable based on reviews. We can say that none of these features is helpful for classification.
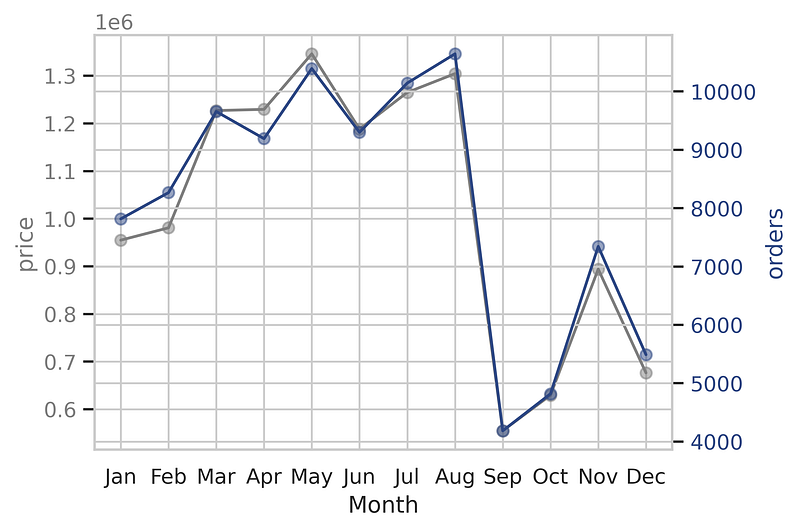
8. Multivariate Analysis
In a multivariate analysis, The evolution of sales and orders between 2016 and 2108 has been plotted. From the plot, we can observe that there is the same pattern of total sales and the total order per month between 2016 and 2018.
9. RFM Analysis
For the given data of customers, I did an RFM analysis on this data.RFM analysis is basically a data-driven customer behaviour segmentation technique.RFM stands for recency, frequency, and monetary value.
RFM stands for-
Recency — number of days since the last purchaseFrequency — number of transactions made over a given periodMonetary — the amount spent over a given period of time
Python code for calculating recency, frequency, and monetary-
Output after creating RFM is shown below-
To know more about this behaviour segmentation technique you can visit here-
The distribution recency, frequency, and monetary of all the customers are shown below.
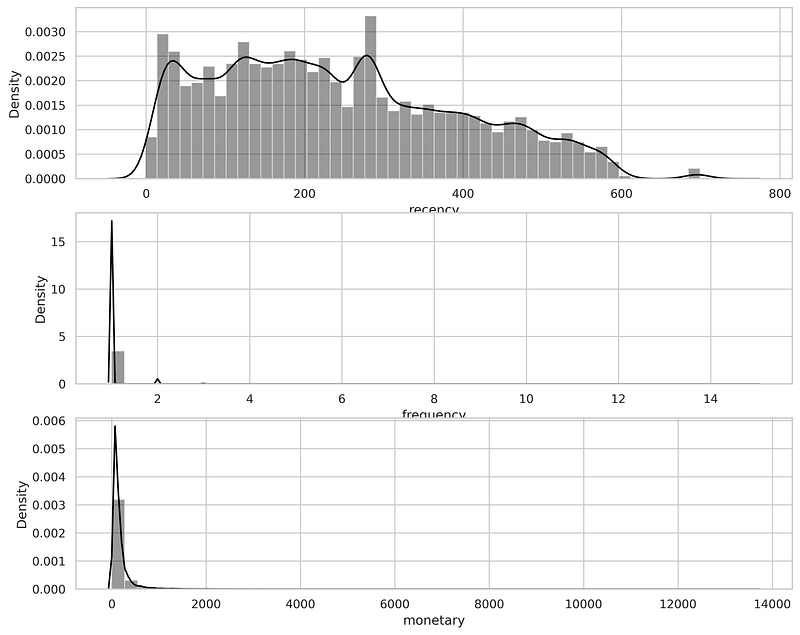
- From the first plot of recency, we can observe that most of the users stayed with Olist for a long duration which is a positive thing but the order frequency is less.
- from the second plot of frequency, the most number of transaction or order is less than 5. from the third plot of monetary the maximum amount spent over the given very period is seems to less than 1500 approx.
The square plot of the behaviour segmentation of the customers shown below.
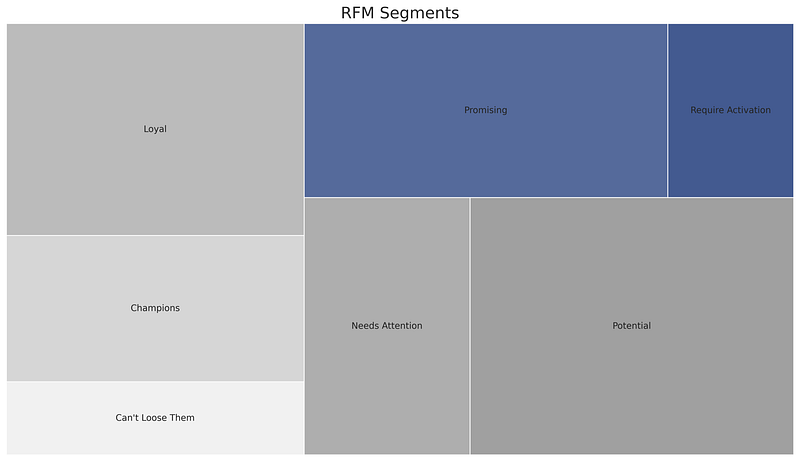
- Based on the RFM_Score_s calculated for all the customers I categorized the customers into 7 categories :
'Can\'t Loose Them' ====  RMF_Score_s  ≥  9
'Champions' ==== 8 ≤ RMF_Score_s < 9
'Loyal' ==== 7 ≤ RMF_Score_s <8
'Needs Attention' ==== 6 ≤ RMF_Score_s <7
'Potential' ==== 5 ≤ RMF_Score_s < 6
'Promising' ==== 4 ≤ RMF_Score_s < 5
'Require Activation' RMF_Score_s <4- From the above square plot, the highest percentage of customers lies within the area of category potential. Few areas are also there with coloured in blue scale which shows the percentage of consumers who require more attention so that they can retain in Olist.
- We can use either RMF_Score_s or RMF_Level as a feature to solve this problem.
After merging, data cleaning, and data analysis of data we will get the final data which can be used further for preprocessing and feature extraction.
10. Conclusion
* The target variable/class-label is imbalanced.We should be carefull while choosing the performance metric of the models.* From the univariate analysis of payment_type we observed that 96 % of the user used credit card and boleto and concluded that this can be our important feature.* Also,from the univariate analysis of consumer_state we found that 42% of total consumers are from the SP(São Paulo), 12.9 % are from RJ(Rio de Janeiro) and 11.7 % are from MG(Minas Gerais).* After analyzing the product_category feature we observed that the most ordered products are from the bed_bath_table category, health beauty, and sports_leisure between 2016 and 2018. The least ordered products are from security_and_services.* The different timestamps seem to be important features as many new features can be explored from these. we observed within 2016–18 the total number of orders received is increasing till 2017–11 and after that their a small decrement. from the month, day and time we observed the most number of orders are received in the month of Feb, on Monday and afternoon time.* The numerical features like price, payment_value, freight_value,product_height_cm,product_length_cm doesnot seems to be helpful for this classification problem as observed from univariate and bivarate analysis.Also we can say linear model like KNN, Naive Bayes might not work well.* RMF Analysis is also done to understand whether new features can be created from this or not and we found that one numerical feature or categorical feature can be extracted from this.Thanks for reading, have a good day! 🙂


