
Exploratory Data Analysis (EDA): A Technique For Visualizing and Summarizing Data

The crucial aspect of data analysis that allows you to gain insights and identify patterns in your data is Exploratory Data Analysis (EDA).
EDA is a process of summarizing and visualizing data to help understand its main characteristics.
The purpose of EDA is to uncover the underlying structure of the data and to identify any relationships, patterns, or outliers.
Through EDA, you can make informed decisions about how to best analyze your data, develop hypotheses, and ultimately, gain a deeper understanding of the data.
Whether you are a data scientist, business analyst, or student, EDA is an essential step in the data analysis process that can provide valuable insights and inform your next steps.
By investing time in EDA, you can increase the accuracy and effectiveness of your analysis, leading to better results and more informed decisions.
What is Exploratory Data Analysis (EDA)?

Exploratory Data Analysis (EDA) is a method of assessing data sets in order to summarize their key qualities, which is typically done visually.
A statistical model may or may not be used, but the major goal of EDA is to discover what the data may tell us that goes beyond the formal modeling or hypothesis testing. It is a critical stage in the data analysis process because it allows the analyst to become acquainted with the data, spot trends, and develop basic assumptions that will be evaluated later.
One of the main objectives of EDA is to detect patterns and relationships between variables, as well as to identify any unusual observations or outliers. This can be done through a variety of techniques, including univariate analysis, bivariate analysis, and multivariate analysis.
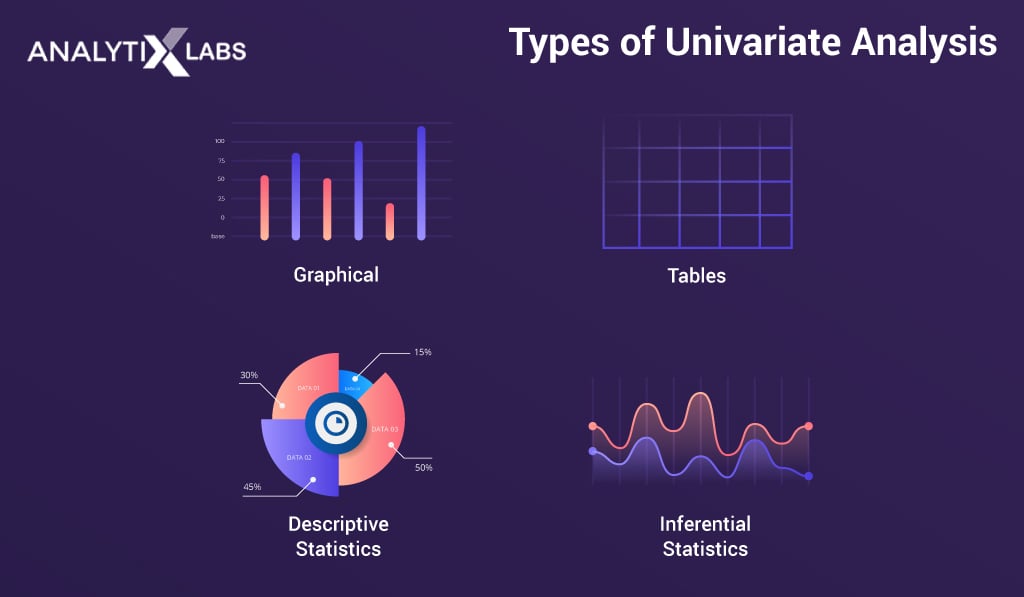
Univariate Analysis
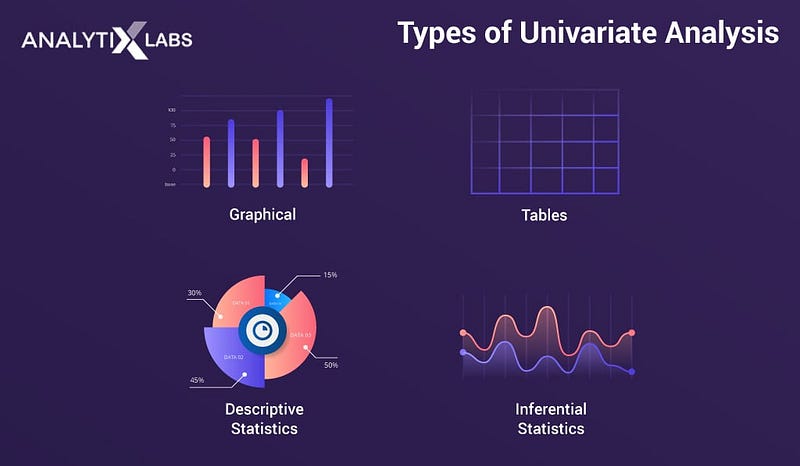
The univariate analysis involves examining each variable independently to understand its distribution and to identify any outliers or unusual observations.
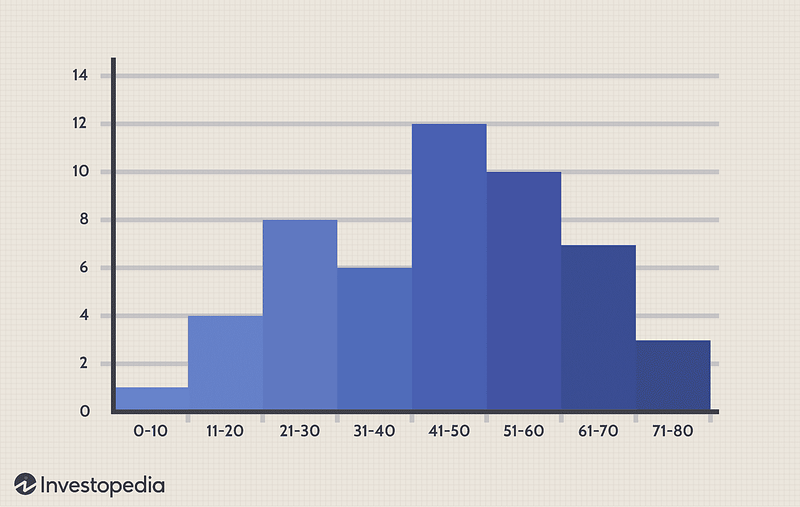
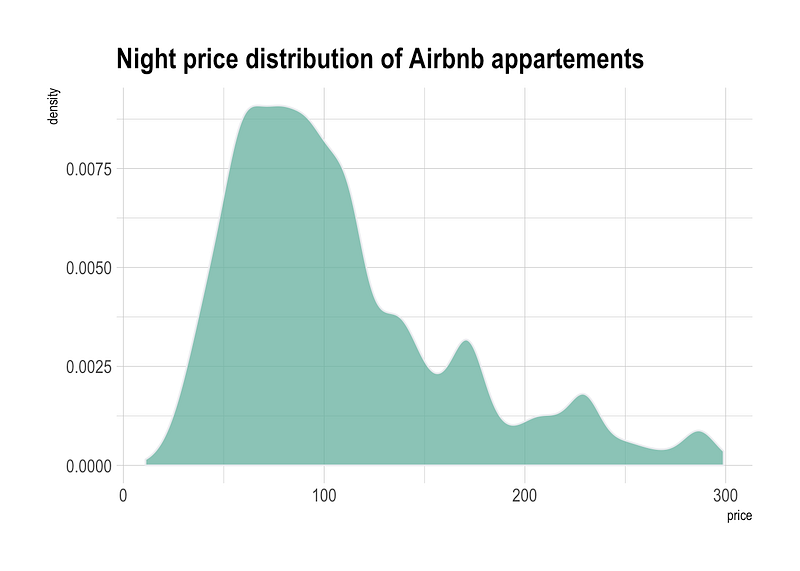
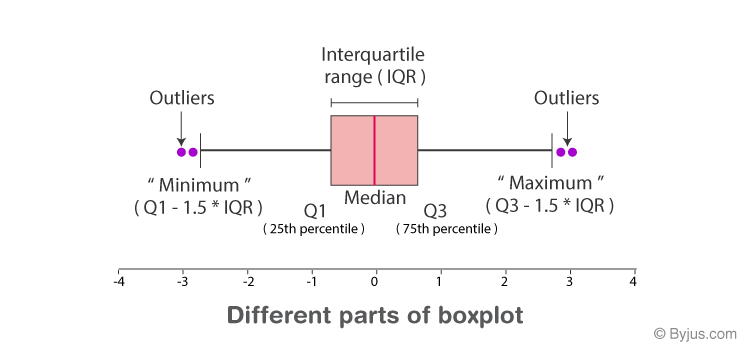
This can be done using techniques such as histograms, density plots, and box plots.
A histogram is a graph that represents the distribution of a set of continuous data by dividing the data into bins and counting the number of observations in each bin.
A density plot is similar to a histogram, but instead of counting the number of observations in each bin, it shows the probability density of the data.
A box plot is a graph that shows the median, quartiles, and outliers to show the distribution of a set of data.
Bivariate Analysis
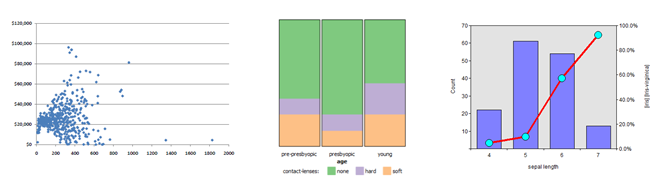
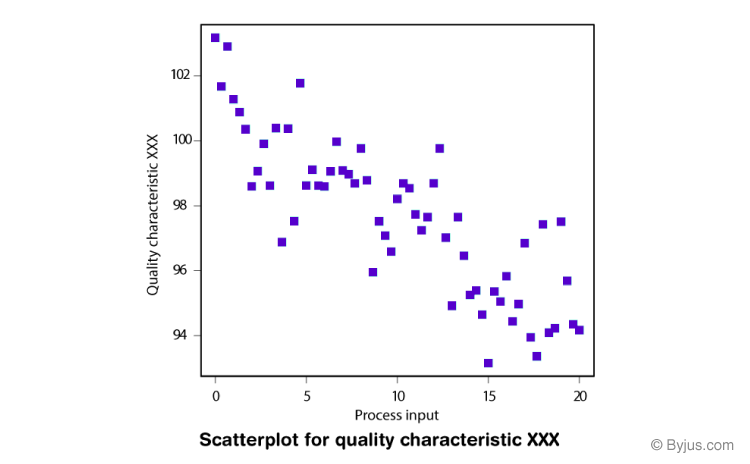
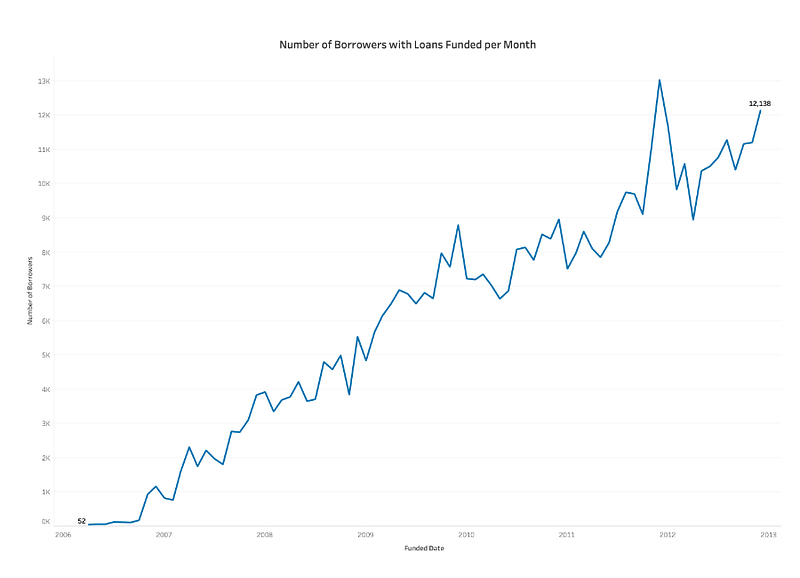
The bivariate analysis involves examining the relationship between two variables. This can be done using techniques such as scatter plots, line plots, and bar plots.
A scatter plot is a graph that plots the values of two variables against each other to see if there is a relationship between the two variables.
A line plot is a graph that shows the trend of a single variable over time. A bar plot is a graph that shows the frequency or the average of a variable across different categories.
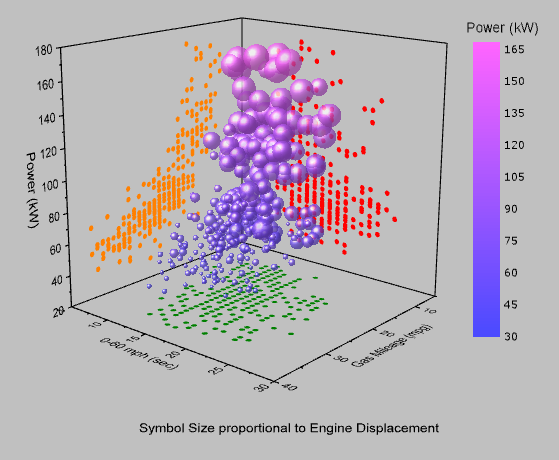
Multivariate Analysis
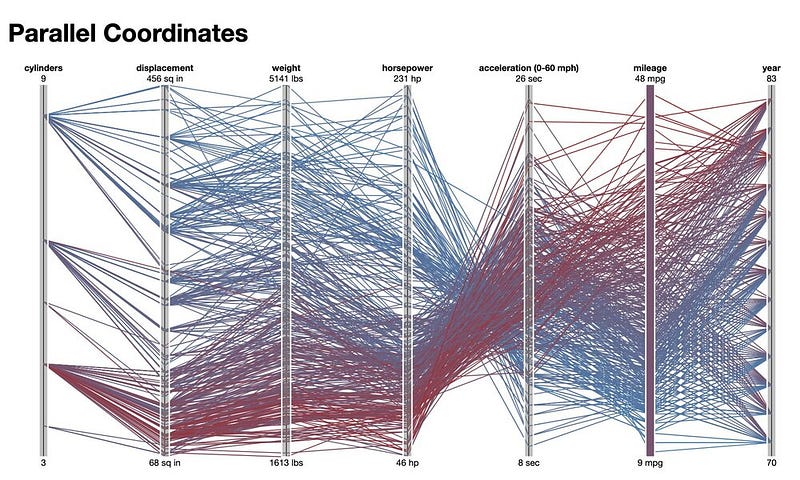
The multivariate analysis involves examining the relationships between three or more variables. This can be done using techniques such as 3D scatter plots, parallel coordinate plots, and heat maps.
A 3D scatter plot is a graph that plots the values of three variables against each other in three dimensions.
A parallel coordinate plot is a graph that plots the values of multiple variables against each other, with each variable on a separate axis.
A heat map is a graph that shows the values of two variables as colors in a 2D matrix.

Another objective of EDA is to identify any missing or inconsistent data and to deal with it appropriately. This can be done through techniques such as checking for missing values, imputing missing values, and transforming variables.
- Checking for missing values involves identifying which observations have missing data and how much data is missing.
- Imputing missing values involves filling in the missing data with a reasonable estimate.
- Transforming variables involves changing the scale or distribution of the data to make it easier to analyze.
EDA is an iterative process and may involve multiple rounds of visualization and summary statistics to gain a deeper understanding of the data.
It is important to keep in mind that the results of EDA are not conclusive, and further hypothesis testing and formal modeling may be required to confirm any patterns or relationships that are identified.
Let’s take an example to demonstrate the process of EDA. Suppose we have a dataset that contains information about car prices, horsepower, and miles per gallon for a sample of cars.
The first step in the EDA process would be to load the data into a software program and generate summary statistics, such as the mean, median, and standard deviation of each variable.
Next, we would generate histograms and density plots for each variable to get a sense of their distribution. We would also generate box plots to identify any outliers or unusual observations.
In this case, we might find that the distribution of car prices is skewed to the right, with a few very high-priced cars, while the distribution of horsepower is roughly symmetrical.
The distribution of miles per gallon is also skewed to the right, with a few cars that have very high miles per gallon.
Next, we would generate scatter plots to examine the relationships between the variables.
We might find that there is a positive relationship between horsepower and car price, which makes sense since higher horsepower cars tend to be more expensive.
We might also find that there is a negative relationship between miles per gallon and car price, which also makes sense since cars with better fuel efficiency tend to be less expensive.
Finally, we would check for missing or inconsistent data and deal with it appropriately. In this case, we might find that there are a few observations with missing values for miles per gallon, so we would need to impute those missing values.
We might also find that the scale of the variables is different, so we would need to transform the variables to make them easier to analyze.
Conclusion
Moreover, exploratory data analysis is a crucial step in the data analysis process that allows us to gain insights and identify patterns in the data.
It involves generating summary statistics and visualizations to understand the distribution and relationships between the variables in the data. By carefully performing EDA, we can make initial hypotheses that can be tested later and gain a deeper understanding of the data.
Thanks…
References
- Exploratory Data Analysis by John W. Tukey (1977)
- Data Science Handbook by Field Cady (2017)
- Data Visualization with ggplot2 by Hadley Wickham (2016)
- An Introduction to Statistical Learning by Gareth James, Daniela Witten, Trevor Hastie, and Robert Tibshirani (2013)
- A Guide to EDA (Exploratory Data Analysis) by KDNuggets (2020)


:max_bytes(150000):strip_icc()/Histogram1-92513160f945482e95c1afc81cb5901e.png)