
Everything You Need to Know About the RSI Indicator
Unlocking the power of the RSI indicator to improve your trading strategy

The Relative Strength Index (RSI) is a technical indicator used by traders to identify overbought and oversold conditions in the market.
I’ll try to explain everything you need to know to start using the RSI for trading.
What is the RSI?
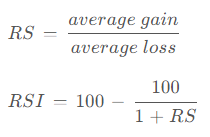
The RSI is a momentum oscillator that compares the magnitude of recent gains to recent losses in an attempt to determine overbought and oversold conditions of an asset.
It is calculated by taking the average gains over a certain period of time and dividing it by the average losses over the same period of time. This results in a ratio, which is then converted into a number between 0 and 100. A value of 70 or above is considered overbought, while a value of 30 or below is considered oversold.
The RSI is a lagging indicator, meaning that it is based on historical data and does not predict future price movements. This means that it may not provide signals in real-time and can be subject to false signals.
How to Use the RSI
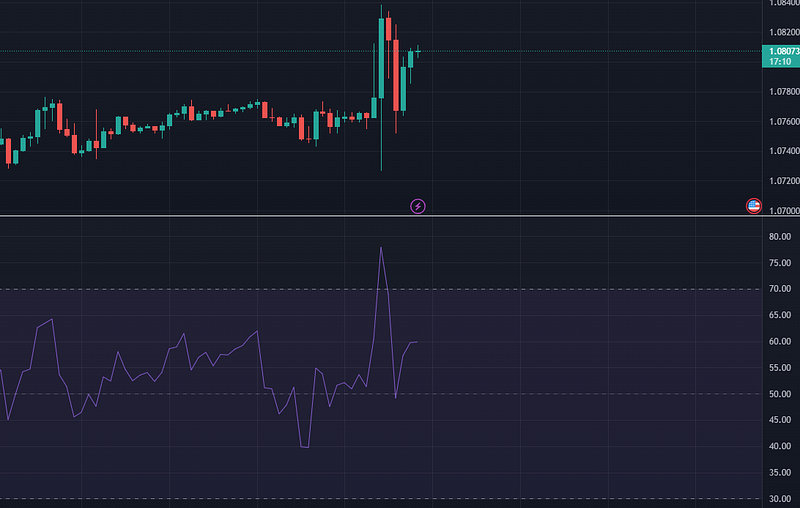
One of the primary uses of the RSI is to identify overbought and oversold conditions in the market. When the RSI is above 70, it is considered overbought, indicating that the asset may be overvalued and due for a price correction. On the other hand, when the RSI is below 30, it is considered oversold, indicating that the asset may be undervalued and due for a price rebound.
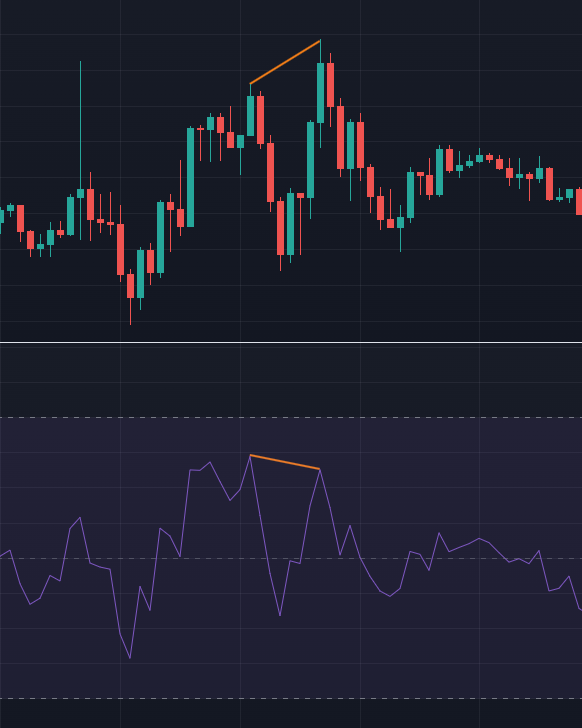
Another way to use the RSI is to identify divergences. A bullish divergence occurs when the RSI is making higher highs while the price is making lower lows. This suggests that the underlying asset is gaining strength and a price reversal may be imminent. A bearish divergence, on the other hand, occurs when the RSI is making lower lows while the price is making higher highs. This suggests that the underlying asset is losing strength and a price reversal may be imminent.
Traders can also use the RSI to identify bullish and bearish signals. A bullish signal is generated when the RSI crosses above the 50 level and a bearish signal is generated when the RSI crosses below the 50 level.
The RSI is not a standalone indicator and should be used in conjunction with other technical indicators and analysis techniques to take a decision. Also, the RSI does not give signals in real-time and can be subject to false signals as it’s a lagging indicator.
Combining the RSI and other Indicators
As I said before, the RSI is not a standalone indicator. It’s better to use it with other indicators such as:
- Moving averages: by combining the RSI with moving averages, you can get a clearer picture of the overall market sentiment and make more informed trading decisions. For example, if the RSI is overbought and the moving average is trending downward, it may indicate a potential sell opportunity.
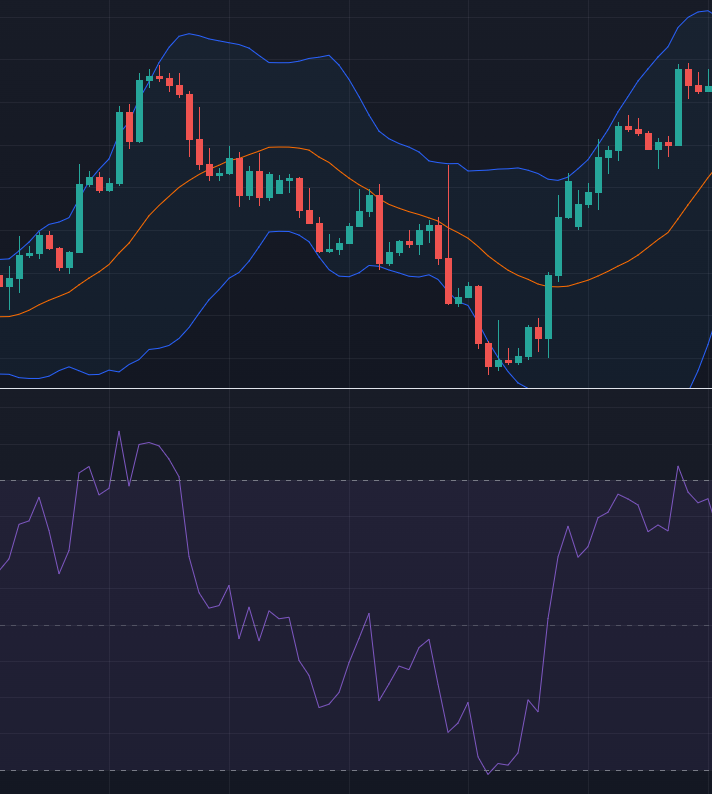
- Bollinger Bands: Bollinger Bands are a volatility indicator that consists of a simple moving average and two standard deviation lines. By combining the RSI with Bollinger Bands, you can identify potential trend breakouts. For example, if the RSI is overbought and the price is nearing the upper Bollinger Band, it may indicate a potential sell opportunity.
Choosing an RSI Period
The RSI’s period setting is an important factor to consider when using the indicator. The period setting determines the number of time periods used to calculate the RSI, and it can affect the outcome of the indicator.
The most commonly used period setting for the RSI is 14 periods. This is the default setting used in most charting software and is considered a good starting point for most traders. A 14-period RSI can provide a good balance between sensitivity to short-term price movements and reliability. However, this may not be the best setting for all traders and all markets.
Traders who are looking for more signals and are willing to accept more false signals may want to use a shorter period setting, such as 5 or 9 periods. Shorter period settings are more sensitive to short-term price movements and can generate more signals but also more false signals.
On the other hand, traders who are looking for fewer signals and are willing to accept fewer false signals may want to use a longer period setting, such as 25 or 50 periods. Longer period settings are less sensitive to short-term price movements and can generate fewer signals but they will be more reliable.
Final Note
It is important to remember that the RSI, like any indicator, should not be used on its own. Technical indicators are simply tools that can help traders make better decisions, but they should always be used in conjunction with other analysis techniques such as fundamental analysis and market sentiment.
Additionally, it’s worth noting that the RSI is a lagging indicator, meaning that it is based on historical data and does not predict future price movements. Therefore, it is important to use it along with other indicators to confirm signals, and use other analysis techniques to get a complete market picture.
To explore more of my trading stories, click here! You can also access all my content by checking this page.
If you liked the story, don’t forget to clap, comment, and maybe follow me if you want to explore more of my content :)
You can also subscribe to me via email to be notified every time I publish a new story, just click here!
If you’re not subscribed to medium yet and wish to support me or get access to all my stories, you can use my link:
A Message from InsiderFinance

Thanks for being a part of our community! Before you go:
- 👏 Clap for the story and follow the author 👉
- 📰 View more content in the InsiderFinance Wire
- 📚 Take our FREE Masterclass
- 📈 Discover Powerful Trading Tools