
Evaluate OCR Output Quality with Character Error Rate (CER) and Word Error Rate (WER)
Key concepts, examples, and Python implementation of measuring Optical Character Recognition output quality

Contents
(1) Importance of Evaluation Metrics (2) Error Rates and Levenshtein Distance (3) Character Error Rate (CER) (4) Word Error Rate (WER) (5) Python Example (with TesseractOCR and fastwer)
Importance of Evaluation Metrics
Great job in successfully generating output from your OCR model! You have done the hard work of labeling and pre-processing the images, setting up and running your neural network, and applying post-processing on the output.
The final step now is to assess how well your model has performed. Even if it gave high confidence scores, we need to measure performance with objective metrics. Since you cannot improve what you do not measure, these metrics serve as a vital benchmark for the iterative improvement of your OCR model.
In this article, we will look at two metrics used to evaluate OCR output, namely Character Error Rate (CER) and Word Error Rate (WER).

Error Rates and Levenshtein Distance
The usual way of evaluating prediction output is with the accuracy metric, where we indicate a match (1) or a no match (0). However, this does not provide enough granularity to assess OCR performance effectively.
We should instead use error rates to determine the extent to which the OCR transcribed text and ground truth text (i.e., reference text labeled manually) differ from each other.
A common intuition is to see how many characters were misspelled. While this is correct, the actual error rate calculation is more complex than that. This is because the OCR output can have a different length from the ground truth text.
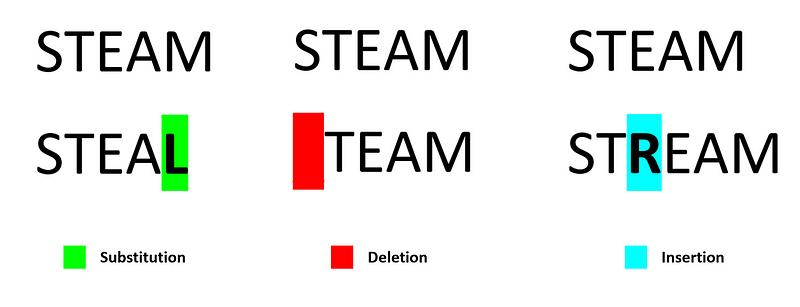
Furthermore, there are three different types of error to consider:
- Substitution error: Misspelled characters/words
- Deletion error: Lost or missing characters/words
- Insertion error: Incorrect inclusion of character/words
The question now is, how do you measure the extent of errors between two text sequences? This is where Levenshtein distance enters the picture.
Levenshtein distance is a distance metric measuring the difference between two string sequences. It is the minimum number of single-character (or word) edits (i.e., insertions, deletions, or substitutions) required to change one word (or sentence) into another.
For example, the Levenshtein distance between “mitten” and “fitting” is 3 since a minimum of 3 edits is needed to transform one into the other.
- mitten → fitten (substitute m with f)
- fitten → fittin (substitute e with i)
- fittin → fitting (insert g at the end)
The more different the two text sequences are, the higher the number of edits needed, and thus the larger the Levenshtein distance.
Character Error Rate (CER)
(i) Equation
CER calculation is based on the concept of Levenshtein distance, where we count the minimum number of character-level operations required to transform the ground truth text (aka reference text) into the OCR output.
It is represented with this formula:

where:
- S = Number of Substitutions
- D = Number of Deletions
- I = Number of Insertions
- N = Number of characters in reference text (aka ground truth)
Bonus Tip: The denominator N can alternatively be computed with: N = S + D + C (where C = number of correct characters)
The output of this equation represents the percentage of characters in the reference text that was incorrectly predicted in the OCR output. The lower the CER value (with 0 being a perfect score), the better the performance of the OCR model.
(ii) Illustration with Example
Let’s look at an example:

- Ground Truth Reference Text: 809475127
- OCR Transcribed Output Text: 80g475Z7
Several errors require edits to transform OCR output into the ground truth:
- g instead of 9 (at reference text character 3)
- Missing 1 (at reference text character 7)
- Z instead of 2 (at reference text character 8)
With that, here are the values to input into the equation:
- Number of Substitutions (S) = 2
- Number of Deletions (D) = 1
- Number of Insertions (I) = 0
- Number of characters in reference text (N) = 9
Based on the above, we get (2 + 1 + 0) / 9 = 0.3333. When converted to a percentage value, the CER becomes 33.33%. This implies that every 3rd character in the sequence was incorrectly transcribed.
We repeat this calculation for all the pairs of transcribed output and corresponding ground truth, and take the mean of these values to obtain an overall CER percentage.
(iii) CER Normalization
One thing to note is that CER values can exceed 100%, especially with many insertions. For example, the CER for ground truth ‘ABC’ and a longer OCR output ‘ABC12345’ is 166.67%.
It felt a little strange to me that an error value can go beyond 100%, so I looked around and managed to come across an article by Rafael C. Carrasco that discussed how normalization could be applied:
Sometimes the number of mistakes is divided by the sum of the number of edit operations (
i + s + d) and the numbercof correct symbols, which is always larger than the numerator.
The normalization technique described above makes CER values fall within the range of 0–100% all the time. It can be represented with this formula:

where C = Number of correct characters
(iv) What is a good CER value?
There is no single benchmark for defining a good CER value, as it is highly dependent on the use case. Different scenarios and complexity (e.g., printed vs. handwritten text, type of content, etc.) can result in varying OCR performances. Nonetheless, there are several sources that we can take reference from.
An article published in 2009 on the review of OCR accuracy in large-scale Australian newspaper digitization programs came up with these benchmarks (for printed text):
- Good OCR accuracy: CER 1‐2% (i.e. 98–99% accurate)
- Average OCR accuracy: CER 2-10%
- Poor OCR accuracy: CER >10% (i.e. below 90% accurate)
For complex cases involving handwritten text with highly heterogeneous and out-of-vocabulary content (e.g., application forms), a CER value as high as around 20% can be considered satisfactory.

Word Error Rate (WER)
If your project involves transcription of particular sequences (e.g., social security number, phone number, etc.), then the use of CER will be relevant.
On the other hand, Word Error Rate might be more applicable if it involves the transcription of paragraphs and sentences of words with meaning (e.g., pages of books, newspapers).

The formula for WER is the same as that of CER, but WER operates at the word level instead. It represents the number of word substitutions, deletions, or insertions needed to transform one sentence into another.
WER is generally well-correlated with CER (provided error rates are not excessively high), although the absolute WER value is expected to be higher than the CER value.
For example:
- Ground Truth: ‘my name is kenneth’
- OCR Output: ‘myy nime iz kenneth’
From the above, the CER is 16.67%, whereas the WER is 75%. The WER value of 75% is clearly understood since 3 out of 4 words in the sentence were wrongly transcribed.
Python Example (with TesseractOCR and fastwer)
We have covered enough theory, so let’s look at an actual Python code implementation.
Click HERE to see the full demo Jupyter notebook
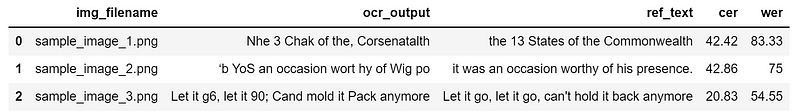
In the demo notebook, I ran the open-source TesseractOCR model to extract output from several sample images of handwritten text. I then utilized the fastwer package to calculate CER and WER from the transcribed output and ground truth text (which I labeled manually).
Summing it up
In this article, we covered the concepts and examples of CER and WER and details on how to apply them in practice.
While CER and WER are handy, they are not bulletproof performance indicators of OCR models. This is because the quality and condition of the original documents (e.g., handwriting legibility, image DPI, etc.) play an equally (if not more) important role than the OCR model itself.
I welcome you to join me on a data science learning journey! Give this Medium page a follow to stay in the loop of more data science content, or reach out to me on LinkedIn. Have fun evaluating your OCR model!


