
Essential Math for Machine Learning: Hypothesis Testing, t-Statistic, and p-Value
This article is part of the series Essential Math for Machine Learning.
Introduction
In the vast and complex world of machine learning, understanding the underlying mathematical concepts is crucial for anyone looking to delve deeper into this field. Among these concepts, hypothesis testing, t-statistic, and p-value stand out as foundational pillars for statistical analysis and inference, enabling data scientists to make informed decisions based on data. This blog post aims to demystify these concepts and illustrate their importance in machine learning.
Hypothesis Testing: The Foundation of Decision Making
Hypothesis testing is a statistical method that allows us to make decisions or inferences about a population based on sample data. In the context of machine learning, it’s often used to validate assumptions, compare models, or check the significance of features.
The Process
1. Formulate Hypotheses: You start by stating two hypotheses — the null hypothesis (H0) and the alternative hypothesis (H1). The null hypothesis represents a default position that there is no effect or no difference, while the alternative hypothesis represents a position that there is an effect or a difference. 2. Choose a Significance Level: The significance level (α) is the probability of rejecting the null hypothesis when it is true. A common choice is 0.05, which means there’s a 5% risk of making a wrong decision. 3. Collect Data and Calculate Test Statistic: Collect your sample and calculate a test statistic that reflects how much the observed data deviates from what would be expected under the null hypothesis. 4. Determine the p-Value: The p-value tells you the probability of observing your data, or something more extreme, if the null hypothesis is true. 5. Make a Decision: If the p-value is less than or equal to α, reject the null hypothesis. Otherwise, do not reject it.
t-statistic: Measuring the Effect
The t-statistic is a type of test statistic used when the sample size is small and the population standard deviation is unknown. It’s calculated as the difference between the sample mean and the population mean, divided by the standard error of the mean. The formula looks like this:
t = (x̄ − μ) / (s / √n)
where x̄ is the sample mean, x̄ is the population mean, s is the sample standard deviation, and n is the sample size. s / √n is known as the standard error of the mean (SEM). SEM quantifies the uncertainty or the standard deviation of the sample mean, providing a measure of how much the sample mean is expected to vary from one sample to another. The SEM decreases as the sample size n increases, meaning larger samples provide more reliable estimates of the population mean.
The t-statistic helps us understand how far the sample mean is from the population mean, measured in units of standard error. It’s crucial for calculating the p-value in t-tests.
p-value: Quantifying Evidence
The p-value is a probability that measures the evidence against the null hypothesis. A small p-value (typically ≤ 0.05) indicates strong evidence against the null hypothesis, so you reject the null hypothesis. A large p-value suggests weak evidence against the null hypothesis, so you do not reject it.
Misconceptions It’s important to note that the p-value is not the probability that the null hypothesis is true. Instead, it’s the probability of observing data at least as extreme as the data observed, under the assumption that the null hypothesis is true.
Example: A/B Testing for 2 ML Algorithms
In machine learning, these statistical concepts are used extensively in feature selection, model validation, and hypothesis testing to compare different models. For instance, when deciding whether a new feature improves your model, you might use a t-test to compare the model’s performance with and without the feature. The p-value from this test can help you determine if the improvement is statistically significant.
Let’s illustrate these concepts with Python code. We’ll simulate the performance of two algorithms with random data to determine if the difference in their mean performance is statistically significant.
The code is available in this colab notebook:
import numpy as np
from scipy import stats
# Set seed for reproducibility
np.random.seed(42)
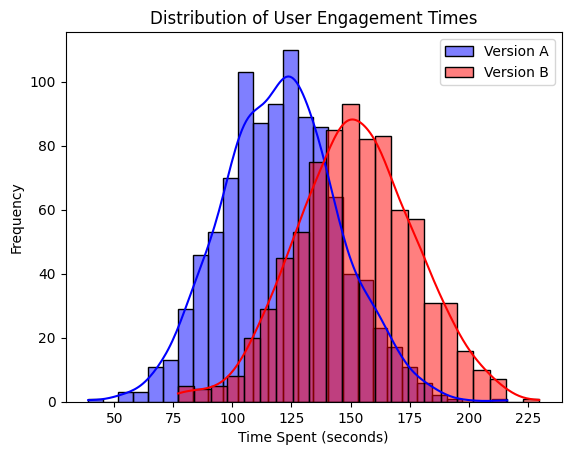
# Simulate engagement times (in seconds)
engagement_A = np.random.normal(loc=120, scale=25, size=1000) # Version A
engagement_B = np.random.normal(loc=150, scale=25, size=800) # Version B
import matplotlib.pyplot as plt
import seaborn as sns
sns.histplot(engagement_A, color='blue', label='Version A', kde=True)
sns.histplot(engagement_B, color='red', label='Version B', kde=True)
plt.legend()
plt.title('Distribution of User Engagement Times')
plt.xlabel('Time Spent (seconds)')
plt.ylabel('Frequency')
plt.show()
t_stat, p_value = stats.ttest_ind(engagement_A, engagement_B)
print(f"T-statistic: {t_stat:.2f}, P-value: {p_value:.4f}")Output:
T-statistic: -26.96, P-value: 0.0000Interpreting the result
If you obtained a result with a t-statistic of -26.96 and a p-value of 0.0000 in your hypothesis testing, this indicates a very significant finding. Here’s what these results mean in the context of comparing the performance of two algorithms:
T-Statistic: -26.96
The t-statistic is a measure of the difference between the two groups relative to the variation in the data. A t-statistic of -26.96 is extremely large in magnitude, which suggests a significant difference between the two groups. The negative sign indicates that the mean performance of the first group (Algorithm A, in our example) is less than the mean performance of the second group (Algorithm B), assuming you calculated Algorithm A’s performance minus Algorithm B’s performance.
P-Value: 0.0000
The p-value indicates the probability of observing the data (or something more extreme) if the null hypothesis is true. A p-value of 0.0000 (which might be rounded down for display purposes and might actually be a very small number close to zero) suggests that the probability of observing such a large difference in means purely by chance is virtually zero. This means there is strong evidence against the null hypothesis, which posited that there is no difference in the performance of the two algorithms.
Given these results, you can reject the null hypothesis with high confidence and conclude that there is a statistically significant difference in the performance of the two algorithms. Specifically, the data strongly suggest that Algorithm B performs better than Algorithm A, given the direction indicated by the negative t-statistic. These findings are compelling and suggest that the observed difference in performance is not due to random variation in the sample data; instead, it’s likely due to a genuine difference in the effectiveness of the two algorithms.
Conclusion
Understanding hypothesis testing, t-statistic, and p-value is essential for anyone involved in machine learning. These concepts form the backbone of statistical inference, allowing us to make data-driven decisions and draw meaningful conclusions from our models. By mastering these fundamentals, you can enhance your machine learning projects, ensuring your decisions are both robust and reliable.


