
End-to-End Machine Learning Workflow [Part 1]
How to use machine learning to solve real-world business problems.
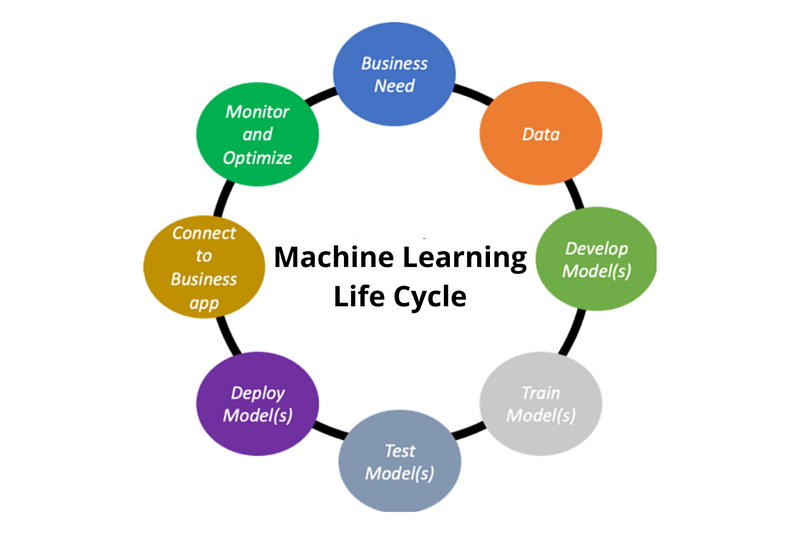
Applying machine learning to solve real business problems, is not just feeding the data into your machine learning model, but it is a more complex problem, that requires hands-on experience and analytical skills. It starts with asking the right questions about the business goals and constraints to inform the machine learning system design. After that define the potential data sources and how they will be collected. Then, explore and understand it. After that comes the most time-consuming step for a data science job which is data cleaning and feature engineering.
Starting from here your data is ready to be fed into a suitable machine learning model which is selected based on your understanding of the problem. The right evaluation metrics should be used to contextualize model performance in terms of business impact. In the end, this model will be deployed in a suitable environment, depending on the business goal and technical requirement, and then it will be monitored and actions will be taken if needed based on the feedback from the monitoring process.
In this article, we will go through all of the first five steps in detail to give a better and deeper intuition of using machine learning to solve a real-world business problem.
If you want to study Data Science and Machine Learning for free, check out these resources:
- Free interactive roadmaps to learn Data Science and Machine Learning by yourself. Start here: https://aigents.co/learn/roadmaps/intro
- The search engine for Data Science learning resources (FREE). Bookmark your favorite resources, mark articles as complete and add study notes. https://aigents.co/learn
- Want to learn Data Science from scratch with the support of a mentor and a learning community? Join this Study Circle for free: https://community.aigents.co/spaces/9010170/
If you would like to start a career in data science & AI and you do not know how. I offer data science mentoring sessions and long-term career mentoring:
- Long-term mentoring: https://lnkd.in/dtdUYBrM
- Mentoring sessions: https://lnkd.in/dXeg3KPW
Join the Medium membership program for only 5 $ to continue learning without limits. I’ll receive a small portion of your membership fee if you use the following link, at no extra cost to you.
Step 1: Clarify the problem and constraints
The first step is defining the business and product problem correctly, which if done right, half of the work is already accomplished. This is because understanding the business motivation, technical requirements, and stakeholders' concerns will lead to the success of the deployed machine learning solution. Therefore, it is very important to understand the business problem before starting and to have well-defined business questions that the data would answer after that.
Some questions that could be used to understand the business problem and the constraints are the following:
- What is the dependent variable we are trying to model?
- How was the problem handled in the past? and if there is a baseline performance we can compare to and with how much should we beat this performance, so that the project could be considered successful?
- How would the end-users benefit from this and would they use the system as a standalone or it will be integrated into an existing system?
These previous questions will help to have a better understanding of the business problem. Also, it is important to know the technical requirements and constraints as they will help you to save weeks of work and avoid painful iterations. The following questions will help in defining the technical requirements and constraints:
- What is the latency required? Does every part of the system be real-time?
- Where will the model be deployed?
- How many predictions are expected per minute?
Step 2: Metrics Establishment
Metrics establishment is the next step, after understanding the business problems and defining them. First, you should obtain observable and attributable metrics that will encapsulate solving the problem. Sometimes the business owner is only interested in optimizing their existing business KPIs, so you have to be able to align the model performance metrics with solving the business problem.
In real-world problems, it is also good to optimize for one metric, rather than using multiple metrics for subgoals. It will help in a better model performance ranking and also easier to align the team around one single metric. The metric also will depend on your data and also the problem you are working on. For example, working with imbalanced data, you cannot use accuracy as an evaluation metric, since it will be misleading. Also if you are working in the medical domain, where you want to decrease the number of false-negative as small as possible, so we can optimize the recall with a fixed threshold on the precision. After picking up the evaluation metrics, it is important to define a baseline for success. This depends on what was mentioned in step 1
Step 3: Data Collection

Data collection is the process of collecting data to solve the problem statement. So it is important to have a good understanding of the problem at hand as mentioned in step 1, to guarantee that the data collected would represent the problem we are trying to solve. After that, you should decide which data sources will be used, whether you will use the organization's internal or collected user data by it, external data, second and third-party data sources, or even synthesis of the data.
External data sources might come from governmental organizations, user surveys, crowdsourcing using Amazon Mechanical Truck or other similar services, or scraping data from online sources related to your problem. An important point that is worth mentioning here, is that you should be fully aware of the ethical issue related to data collection and data privacy. If you are using users' data, make sure they are aware that you are collecting data about them and that it will be for business purposes. If you are buying data from second-and third-party data sources, your legal team must be careful to consider all data privacy clauses.
Step 4: Data Exploration
In this step, we would like to have a better understanding of the collected data and have better intuition of whether the collected data represents the problem we are trying to solve or not. A very good starting point is to have quick look at the data features to get an intuition about which feature could be useful, which has no variance and therefore will add small predictive power. Another quick step that can be done is also calculating the descriptive statistics of the data, such as the mean, median, variance, and quantiles.
After that, you can have a deeper understanding of the features by visualizing them. Numerical features can be visualized by plotting their distribution and having a look at their statistical properties, such as skewness and kurtosis. For categorical features, the distribution is better visualized using histograms. Finally, you can calculate and visualize the correlation between the features and also the features with the target value.
Step 5: Data Cleaning
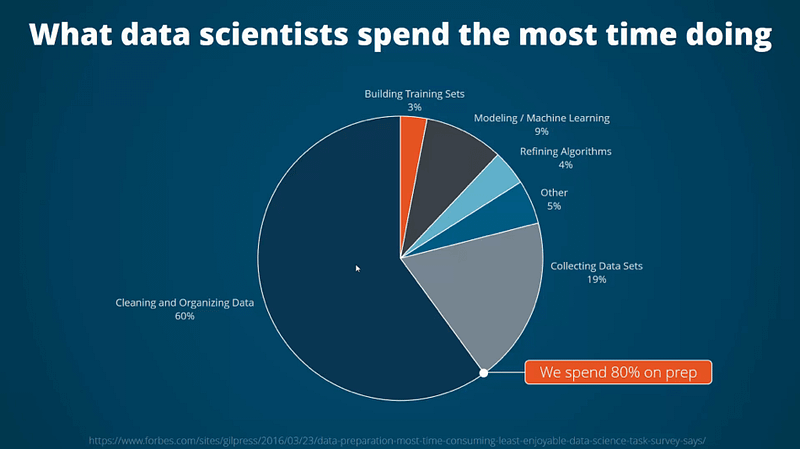
It is now a well-known fact in the data science community that data scientists spend 80% of their time cleaning data. The reason for that is that your model is only good as your data, and the solution for a lot of complex problems might be in the data not in the model. Data problems arise from missing data, errors in data entry, login issues, changing schemas due to product changes, and problems in data merging.
A very common problem is missing data. To handle this problem, it is important to have a good understanding of the root cause and analyze the missing data to know whether it’s at random or not. Some of the techniques that could be used to deal with missing data:
- Imputing the missing values with the feature mean or median.
- Using a predictive model to impute the missing data.
- Dropping the rows with missing values.
Another critical data cleaning step is dealing with outliers. Outliers might be due to problems in data collection, such as data entry errors or logging hiccups. Outliers can be removed outright, truncated, or left, depending on their source and the business implications of including them or not. Outliers might be univariate and could also be multivariate, in which you should be looking over many dimensions.
The next five steps which are feature engineering, model selection, model training and evaluation, deployment, and iteration will be covered in part 2. The end-to-end workflow mentioned in parts 1 and part 2 will also be applied to a real-world business problem and will be represented in part 3.