
A Complete Dashboard Project in R Shiny App
A step-by-step guide to building a live interactive dashboard in R Shiny. Full codes accessible.
To get a taste of what we will build in this guide you can take a look at the live dashboard: https://gesurvey.shinyapps.io/Graduate-Employment-Survey/
Now, one can ask why R and Shiny App? I would answer - because it is free, scalable, and easy to learn, supported by a generous & enthusiastic community, and it's pretty.
The full codes of the dashboard project on Github.
Content
- Data sources
- Data transformation
- Shiny App structure
- Visualizations
- Deployment of the dashboard on https://www.shinyapps.io/ web server.
Our motivation is that the dashboard will help young people of Singapore and those seeking study opportunities in Singapore to analyze which university & degree has a better outcome with regards to employment & income.
Let’s get started!
1. Data Sources
We will use two datasets in this project.
- Graduate employment survey dataset can be found here: data.gov.sg/ges
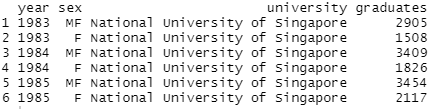
- The number of graduates by university dataset can be found here: data.gov.sg/gra
As mentioned the main metrics of the analysis are:
- Employment Rate
- Monthly Gross Income
We will use the following R packages:
2. Data transformation
The standard workflow about data transformation looks like this:
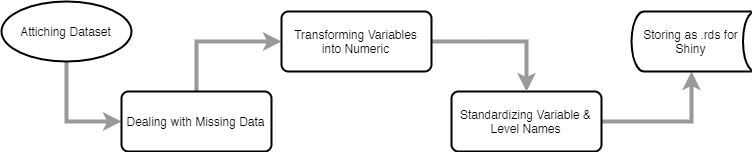
In the codes provided on GitHub (DataWrangling.R), we will basically attach dataset, clean NAs, fill missing values, change university names to make it more intuitive, and finally, we will save the data frames in .rds format which is much faster to read at the next steps.
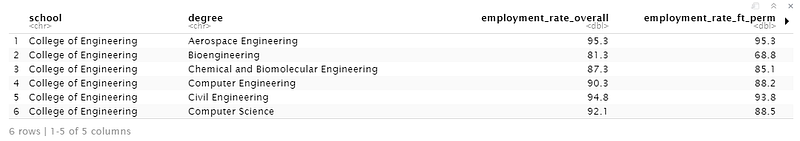
If you see the names of the school unique(data_e$school) in the dataset there are some names that need cleaning, for example:
Transforming factor variables into numeric:
data_e <- data_e %>% modify_at(c(5:12), as.numeric)And finally, saving cleaned data frame as .rds extension for Shiny:
saveRDS(data_e, file = “data/employment_data.rds”)3. Shiny App structure
To run a Shiny App you need to install the package & import the library:
install.packages("Shiny")
library(Shiny)
Shiny applications have two important components, I call them front-end ui.R and back-end server.R.
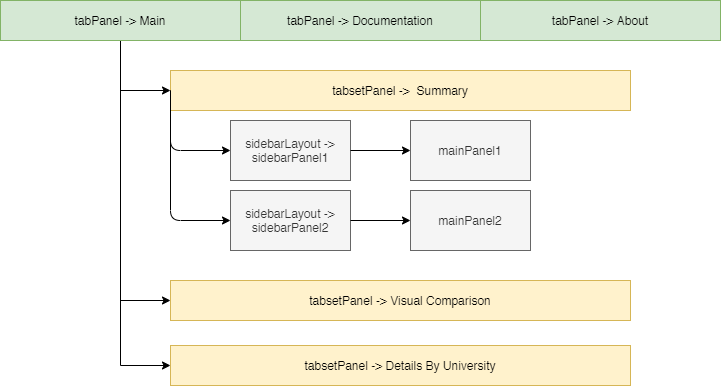
In ui.R we create a structure of front-end, how we want our web application to look like.
This is the basic diagram of the ui for our dashboard:
Now, let’s run the first example of ui.R and its corresponding server.R codes.
We have front-ent, now we need the corresponding back-end. If you look at lines 21 and 21 we have table output “datahead” and plot output “piePlot”. Let’s configure the server.R.
After running the ui.R or server.R code the result is below:
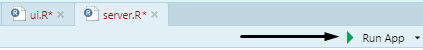
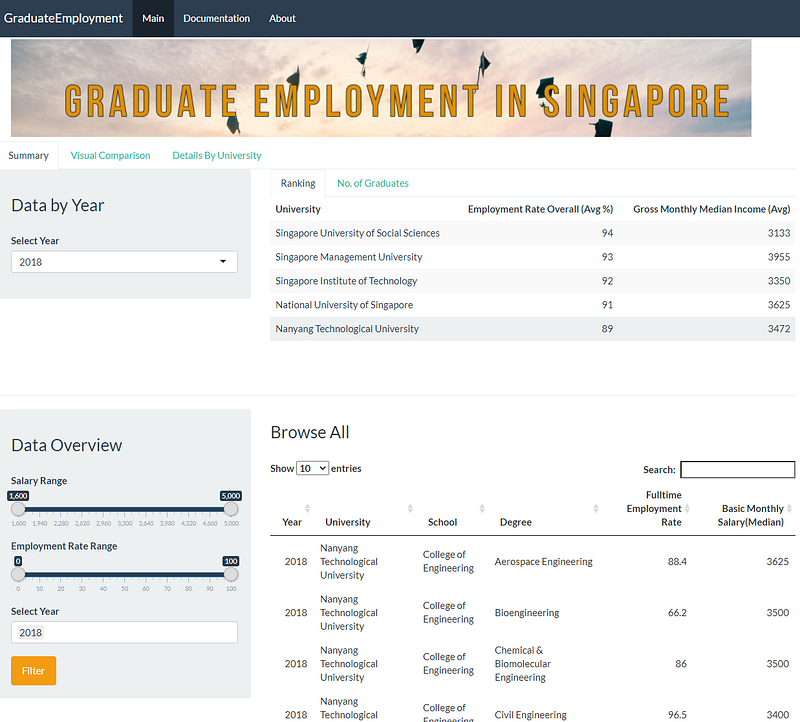
The full codes are on GitHub for ui.R and server.R. You will need to have ui.R and server.R in the same folder in separate R files. When you run one of the R files the Shiny App will open.
4. Visualizations
Visualizations are mostly done in Plotly and the data tables are presented in Kable. I recommend checking some examples on the internet because they are so fancy! Here are useful links for Plotly interactive graphs and Kable awesome tables.
From the project, I will post here some examples.
Plotly
Let’s dive deeper into the details of the National University of Singapore and list the basic monthly median income for each school. Code example:
Result:
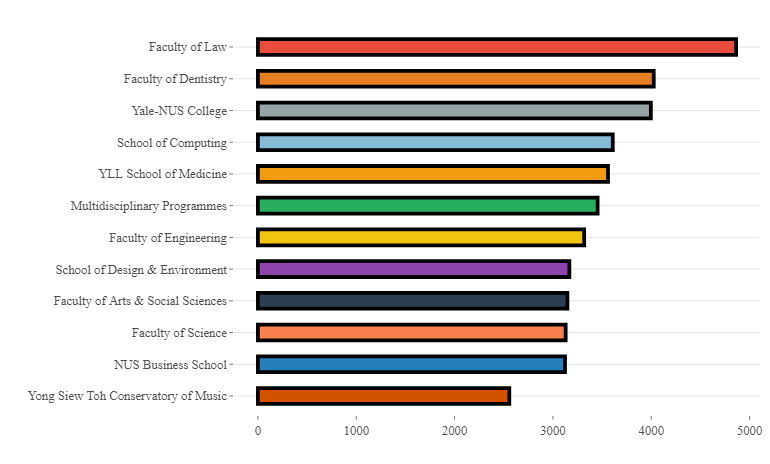
And we can see from the plot that graduates from the College of Law earn the most :).
Kable
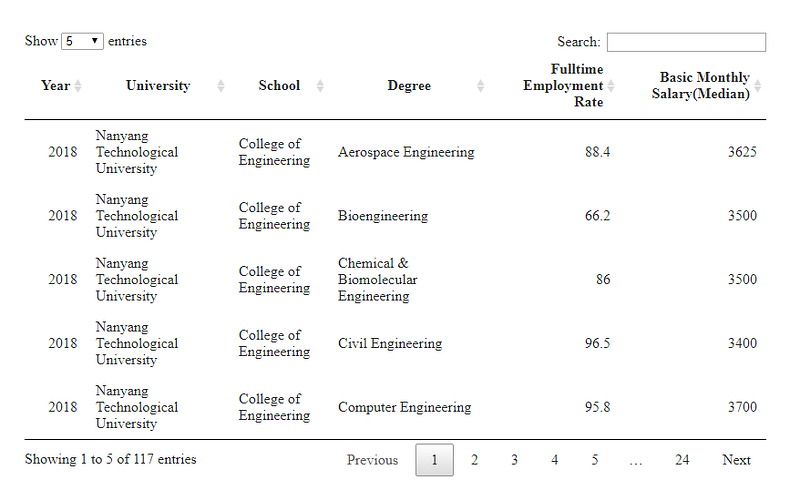
To show the pretty and interactive table of Kable, Let’s see the full table of Fulltime Employment and Balance Monthly Salary (Median) by Universities, their Schools, and Degrees in 2018. Code example:
And the results:
5. Deployment of the dashboard on https://www.shinyapps.io/ web server.
To publish your Shiny App online, you should sign up on www.shinyapps.io, it is free to run three applications.
Please read this guide as it explains in detail what you need to do to create a connection between your app and shinyapps.io server.
Few steps are here:
0. I assume you have ui.R and server.R in the same folder.
- Run code in your R file:
install.packages('rsconnect')
library(rsconnect)
2. Create a shinyapps.io account. Please note that shinyapps.io will use your account name as the domain name for all your apps.
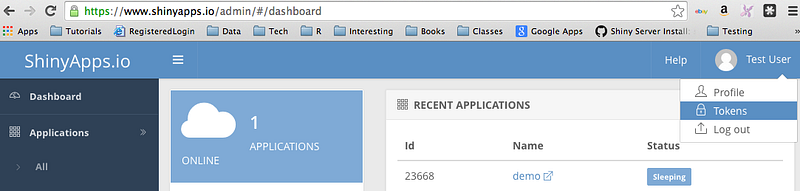
3. When you log in to shinyapps.io, get the token that is generated on the website:
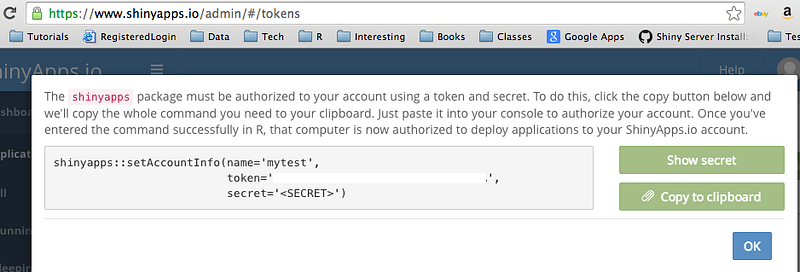
4. Configure rsconnect package to use your account. Citing the website: “Click the show button on the token page. A window will pop up that shows the full command to configure your account using the appropriate parameters for the rsconnect::setAccountInfo function. Copy this command to your clipboard, and then paste it into the command line of RStudio and click enter.”
5. Publish your app. To deploy your application, use the below codes:
library(rsconnect)
deployApp()
Then click the Publish button in R (from ui.R or server.R).
Once the deployment finishes voalaaaa!!! Congratulations! Your first Shiny App is published. If you make changes in ui.R or server.R files you can republish the app.
In this step-by-step guide, I showed you how to build this web dashboard in a Shiny App: https://gesurvey.shinyapps.io/Graduate-Employment-Survey/. We reviewed Data sources, Data transformation, Shiny App structure, Visualizations used in the project, and deployment steps. Feel free to access and use the codes. Downloading and running them should give you the same results. Full codes are here. If you run into issues feel free to drop me a message ;)
Special thanks to Dr. Piotr Wójcik and Mgr. Piotr Ćwiakowski — our teachers in Advanced R at the University of Warsaw. And to my colleague Zimin Luo with whom I was working on this project during Graduate Studies in Data Science at the University of Warsaw.


