
Embedding for Feature Engineering of Stock Symbols using PyTorch
Stock trading is a highly competitive field crowded with the smartest minds in the world. If you are an active trader, you probably have been acclimatized to losses and wins. As trading is a game of probability, you can never find a trading strategy that works 100% of the time. Although this is common sense to most traders, have you found that a trading strategy that works for some stocks does not work for others? This information is critical in your decision-making process, as you want to apply the most likely successful strategy to a stock you are trading. For example, as a day trading practitioner, I can tell from my experience that my 1-minute breakout strategy at the market open generally works okay for some actively traded large-float stocks, but performs terribly for some low-flow stocks under the same actively traded scenario. After you have accumulated sufficient screen time with both losing and winning trades documented in your trade book, you can analyze these trades with the help of AI. Our objective here is to train an AI to distinguish your trading performances based on the stock symbols so that it can inform you whether to trade for your strategy or against your strategy.
To be more clear, let’s look at this example:
You believe you have followed your strategies pretty well and resulting in the following P&L performances on your trade book:
AMD: -$100, $50, $100, $150, $200
AMC: $500, $1000, -$1500, -$100
What does this information tell you?
- You traded AMD 5 times with 4 wins and 1 loss, while you traded AMC 4 times and you had 2 wins and 2 losses.
- The net income for AMD is positive and the net income for AMC is negative.
- You can make more in a single trade by trading AMC, but can also lose more.
Obviously, the feedback to your brain based on this experience is that AMD and AMC are different, despite that their ticker names are only different by one letter. You’d better be careful while trading AMC if using the same strategy for AMD. This sounds intuitive to humans, especially experienced traders, but if we want to develop our own AI to help us make such trading decisions, our AI needs to be trained to distinguish the two stock symbols. This is not easy when you have hundreds or thousands of tickers. Common word embeddings from pre-trained language models won’t work in this case, as they aren’t trained for this specific case. In this article, I’m going to demonstrate how I tackle this problem. If you haven’t done so, please subscribe to my column, so you won’t miss any future similar articles.
Theoretical Foundation
First of all, let’s further simplify the problem by just looking at the first trades of AMC and AMD that resulted in a loss of $100 and a win of $500, respectively. To feed the information to the neural network of AI for training, we should feed “AMD” and “AMC”, and the corrected labels for backpropagation should be “-100” and “500”, respectively. Obviously, the computer can’t read letters, so we need to convert the stock symbols to numbers. We can do sequential coding statically like this: AMD to 1 and AMC to 2. This might work. But we will not be happy with that, because that sequential numbering system inherently tells AI that AMD and AMC are next to each other and their difference is 1, and we know that’s not the case, because AMD is a large-float stock while AMC is a meme stock. When we have hundreds or thousands of tickers, this sequential coding system will introduce big problems. Here is what we need to do: We want the AI to notice the difference between AMD and AMC. To do that, we code the symbols in a different way, which is called embedding.
Instead of using one-dimensional coding using a sequential list of numbers such as 1, 2, 3, …, we will use a two-dimensional coding system (We can also use more than two-dimensional if you like): [0.1,0.1] and [0.9,0.9] for AMD and AMC, respectively. The benefit of doing this is that we can allow a large room of differences between AMD and AMC, which can be learned by AI later. As you can see, their difference is no longer 2–1=1, but the distance of two points (0.1,0.1) and (0.9,0.9) on a 2-D plane: sqrt(0.8²+0.8²)=1.13. Most importantly, this distance will be tweaked during the AI’s learning process as the coordinates of the points are tweaked. The longer the distance, the more difference between the two tickers, suggesting you apply opposite trading strategies while trading the two stocks.
Let’s go through the AI’s learning process of tweaking the 2-D coordinates. First, we start with the first input of our trade record: AMD, -100.
AMD is sequentially coded by a number 1, which is converted to a 1x1 matrix [[1]], and then 2-D coded into a 1x2 matrix by randomly assigning two numbers such as [[0.1,0.1]].
Then we use the 1x1 matrix [[1]] multiplied by the 1x2 matrix [[0.1,0.1]], obtaining a 1x2 matrix [[0.1,0.1]]. We take the mean of the matrix, which condenses the result to a 1x1 matrix [[0.1]]. Since the real label is [[-100]], we need to tweak the 1x2 matrix in a way so that it can achieve [[-100]]. For example, tweaking the matrix to [[-100,-100]] can be a solution. [[-150,-50]] can be a solution, too. When we have a lot of such data, the AI will search for a combination of two numbers for this ticker that can result in a minimum loss.
Implementation with PyTorch
With a good understanding of the theory, now let’s implement the algorithm in PyTorch. We import the following libraries and functions.
import torch
import torch.nn as nn
import torch.optim as optim
import numpy as np
import pandas as pd
import matplotlib.pyplot as plt
from sklearn.preprocessing import StandardScaler
from torch.utils.data import DataLoader,TensorDataset
The dataset is my discretionary trading performance over two years. It is available in my GitHub repository and can be read as follows with Pandas.
link = 'https://raw.githubusercontent.com/tshunyu/medium/main/data/tickers_embedding_data.csv'
df = pd.read_csv(link)
df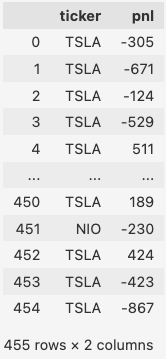
The dataset has 455 rows and 2 columns. The columns are the ticker name and the P&L. I have 455 records in this dataset. If you like, you can use the data from your own trading performance to do this analysis. Unsurprisingly, you will find my discretionary trading performances are really poor, with few wins but many losses. That’s why we are studying algorithmic trading with AI to improve, isn’t it?
Of the 455 records, the unique stock symbols I actually traded were only 205. I sorted these symbols alphabetically and then sequentially assigned them a number from 1 to 205. After that, I added a new column “tickernum” to the original dataframe and iterated through it to match the ticker with the tickernum.
# build a list that contains unique tickers
tickers = sorted(list(set(df.ticker.tolist())))
# convert each unique ticker to a number
ticker_to_num = {ticker:i+1 for i,ticker in enumerate(tickers)}
# convert each tickernum to ticker
num_to_ticker = {v:k for k,v in ticker_to_num.items()}
# assign the number to each ticker in the original dataframe
for i,r in df.iterrows():
    df.loc[i,'tickernum'] = ticker_to_num[r.ticker]
df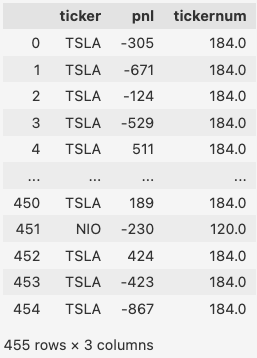
To help with the convergence of algorithms, I used the standard scaler to normalize the P&L while preparing the labels. The inputs are simply the sequentially numbered tickernum. They are formatted as integers for now, because they are going to be used as indices in the embedding matrix later.
pnl_scaler = StandardScaler()
labels = pnl_scaler.fit_transform(df[['pnl']].values)
labels = torch.tensor(labels).float()
inputs = torch.tensor(df[['tickernum']].values).long()

dataset = TensorDataset(inputs,labels)
dataloader = DataLoader(dataset,batch_size=1,shuffle=True)
Now we construct the embedding matrix B. This is the most important step of the whole process. The embedding matrix must have a dimension of 205x2, because we have 205 tickers and each ticker has two coordinates or dimensions. The embedding matrix was created as a randomized PyTorch tensor that requires a gradient, because the elements in the matrix will be tweaked as the AI learns from the data.
B = torch.randn((205, 2), requires_grad=True) # This is the embedding layer. Values will be updated. Visualization of the randomized embedding matrix B is shown as follows.
plt.scatter(B.detach().numpy()[:,0],B.detach().numpy()[:,1])
plt.xlabel('Dim 1')
plt.ylabel('Dim 2')
plt.title('Visualization of the Randomized Embedding Matrix B')
plt.show()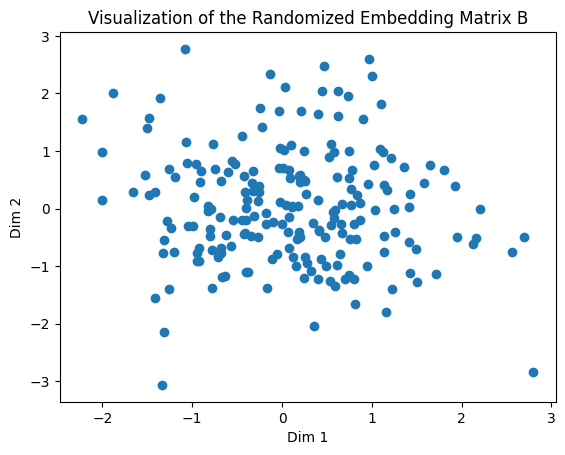
Note that although PyTorch has an embedding layer in its nn module, we can’t use it, because it does not fit into our subsequent step of backpropagation with the loss of mean squared error (MSE), which needs to use a float tensor. Unfortunately, the PyTorch’s nn.Embedding layer only accepts an integer-type long tensor, because it needs an index to search the input vector. We have to write our own embedding algorithm, which is as simple as follows.
criterion = nn.MSELoss()
optimizer = optim.Adam([B],lr=0.001,betas=[0.9,0.999])
train_loss_li = []
n_epochs = 500
for epoch in range(n_epochs):
tloss = 0
for id,(x,y) in enumerate(dataloader):
B.grad = None
output = x.float()@B[x.squeeze(1)-1,:]
y_pred = torch.mean(output,dim=1)
y_pred = y_pred.view(-1,1)
loss = criterion(y_pred,y)
loss.backward()
optimizer.step()
tloss += loss.item()
train_loss_li.append(tloss)
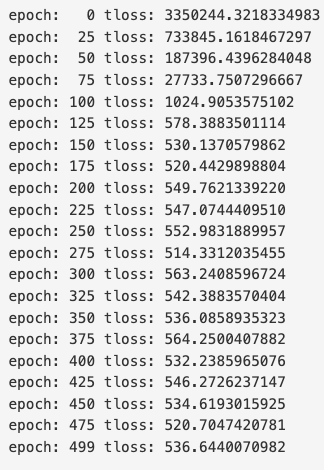
if epoch%25 == 0:
print(f'epoch: {epoch:3} tloss: {tloss:10.10f}')
print(f'epoch: {epoch:3} tloss: {tloss:10.10f}')We take one input tickernum each time from the dataset and multiply the embedding matrix B that has been filtered down to the randomly assigned coordinates for that input tickernum. Then take the average of the resulting vector as the output and compute the MSE loss by comparing the output and the label. Backpropagation then tweaks the coordinate accordingly to minimize the loss. We did 500 epochs and the algorithm converged nicely as you can tell the total loss dropped from 3350244 to 536.
plt.plot(range(len(train_loss_li)),train_loss_li)
plt.ylabel('Loss')
plt.xlabel('No. of Iterations')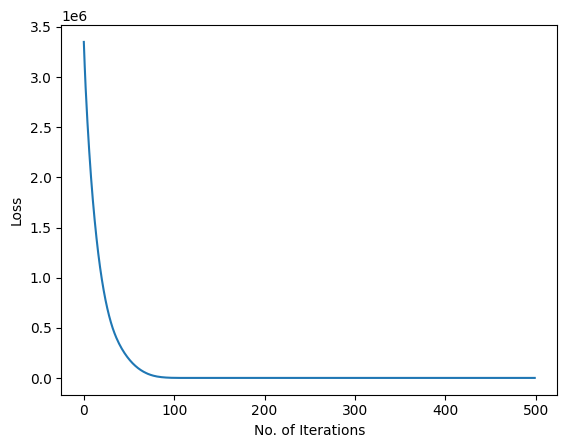
This is the most important milestone! We have got the optimized embedding matrix containing the 2-D coordinates for each ticker. We then map the coordinates to each ticker. This is done by creating another dataframe df1 with my median P&L included for better visualization of the results.
df1 = pd.DataFrame(embeds,columns=['dim1','dim2'])
for i,r in df1.iterrows():
    df1.loc[i,'ticker'] = num_to_ticker[i+1]
    df1.loc[i,'pnl'] = df[df['ticker']==num_to_ticker[i+1]]['pnl'].median()
df1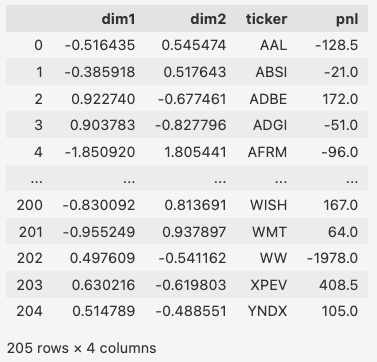
Result Analysis
cm = plt.cm.get_cmap('brg')
plt.scatter(df1.dim1,df1.dim2,c=df1.pnl,cmap=cm)
plt.colorbar()
for i,r in df1.iterrows():
if r.pnl>1000:
plt.scatter(df1.loc[i,'dim1'],df1.loc[i,'dim2'],c='darkgreen')
plt.text(df1.loc[i,'dim1'],df1.loc[i,'dim2'],r.ticker)
if r.pnl<-2000:
plt.scatter(r.dim1,r.dim2,c='darkblue')
plt.text(r.dim1,r.dim2,r.ticker)
if (r.dim1<-1.8) | (r.dim1>1.5):
plt.text(r.dim1,r.dim2,r.ticker)
if (r.ticker == 'AMC') | (r.ticker == 'AMD'):
plt.text(r.dim1,r.dim2,r.ticker)
plt.xlabel('Dim 1')
plt.ylabel('Dim 2')
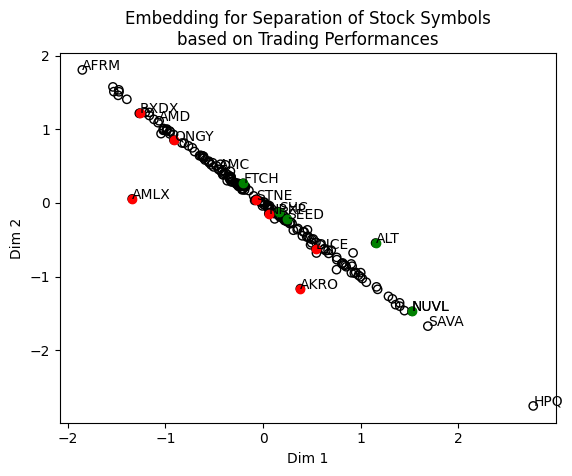
plt.title('Embedding for Separation of Stock Symbols\nbased on Trading Performances')
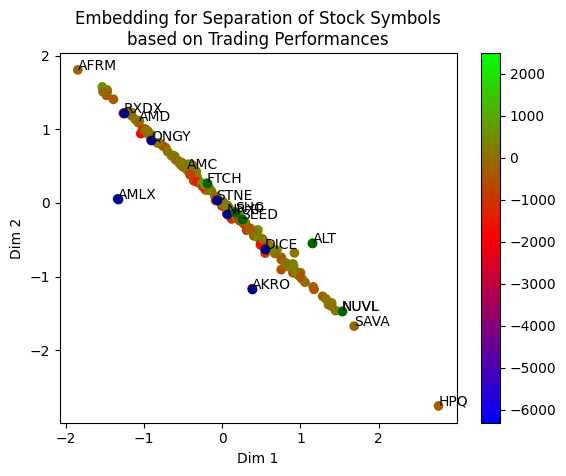
plt.show()Here are the results! The AI has separated the 205 stock symbols based on my trading performances. The color bar is the P&L: Green means very positive, red means very negative, and blue means very very negative. What can we learn from here?
- To answer the question raised at the beginning of the article, I intentionally marked out AMD and AMC. As you can see, they are no longer close to each other as they used to be when they were alphabetically ordered and labeled, suggesting different trading styles may be applied.
- As many tickers lie on the -45 degree line, the far extremes of the line AFRM and HPQ are considered very much different by the AI because they are the most distant from each other. So opposing trading strategies may be applied to them.
- Since I labeled big losses and big wins on the chart, you can see that my two big losers AMLX and AKRO are on the left side of the -45 degree line while my big winner ALT is on the right side. It appears when considering the -45 degree line as a divider, AMLX and AKRO may be applied with opposite strategies compared to ALT.
To focus on the locations of the big winners (green dots) and big losers (red dots), I removed the color of the other tickers.
It may be deduced that I should avoid trading stocks that are close to the red dots, even if I have a green dot nearby. For example, although my record has shown good performance on FTCH — the green dot, the red dot STNE is nearby. So the two stocks are considered very similar. It may be pure luck for me to win the FTCH trades. For better risk management, I may simply avoid trading both stocks and only trade those with no red dots nearby, such as the tickers near the green dot NUVL.
The beneficial use of the embedding matrix is more than this. As I mentioned earlier, stock symbols have a lot of implications for traders, and the correct labeling of the stock symbols is an important step of feature engineering to develop a more capable and robust AI to help us trade. However, this is out of the scope of this article. If you haven’t done so, please subscribe to my channel so that you won’t miss any future articles in greater depth on this topic.
Disclaimer:
I do not make any guarantee or other promise as to any results that are contained within this article. You should never make any investment decision without first consulting with your financial advisor and conducting your own research and due diligence. To the maximum extent permitted by law, I disclaim any implied warranties of merchantability and liability in the event any information contained in this article proves to be inaccurate, incomplete, or unreliable or results in any investment or other losses.
I hope you enjoy reading the article. I periodically publish articles of original content on the applications of machine learning and deep learning in the realms of quantitative trading, finance, and engineering. I’m also writing my book “Day Trade with AI”, which is to be released soon. If you finish reading here and would like to see more of my writings, please follow me on Medium (https://shunyutang.medium.com/) or Twitter (https://twitter.com/shunyutang).
To support me, you can buy me a coffee by clicking here. I drink a lot of coffee while writing!
A Message from InsiderFinance

Thanks for being a part of our community! Before you go:
- 👏 Clap for the story and follow the author 👉
- 📰 View more content in the InsiderFinance Wire
- 📚 Take our FREE Masterclass
- 📈 Discover Powerful Trading Tools