
PYTHON PROGRAMMING
Efficient Coding in Data Science: Easy Debugging of Pandas Chained Operations
How to inspect Pandas data frames in chained operations without breaking the chain into separate statements

Debugging lies in the heart of programming. I wrote about this in the following article:
This statement is quite general and language- and framework-independent. When you use Python for data analysis, you need to debug code irrespective of whether you’re conducting complex data analysis, writing an ML software product, or creating a Streamlit or Django app.
This article discusses debugging Pandas code, or rather a specific scenario of debugging Pandas code in which operations are chained into a pipe. Such debugging poses a challenging issue. When you don’t know how to do it, chained Pandas operations seem to be far more difficult to debug than regular Pandas code, that is, individual Pandas operations using typical assignment with square brackets.
To debug regular Pandas code using typical assignment with square brackets, it’s enough to add a Python breakpoint — and use the pdb interactive debugger. This would be something like this:
>>> d = pd.DataFrame(dict(
...     x=[1, 2, 2, 3, 4],
...     y=[.2, .34, 2.3, .11, .101],
...     group=["a", "a", "b", "b", "b"]
.. ))
>>> d["xy"] = d.x + d.y
>>> breakpoint()
>>> d = d[d.group == "a"]
Unfortunately, you can’t do that when the code consists of chained operations, like here:
>>> d = d.assign(xy=lambda df: df.x + df.y).query("group == 'a'")or, depending on your preference, here:
>>> d = d.assign(xy=d.x + d.y).query("group == 'a'")In this case, there is no place to stop and look at the code — you can only do so before or after the chain. Thus, one of the solutions is to break the main chain into two sub-chains (two pipes) in a place where you want to debug the code, and debug it from there. Most likely, after debugging you will want to return to one chain instead of two, so I personally have never liked using such debugging.
And this is why I came up with the method I’d like to present in this article. I am going to show you a solution for debugging chained Pandas operations that does not require you to break the chain. Instead, you can add something similar to a typical Python breakpoint. Adding and removing this breakpoint is easy, making debugging chained Pandas operations simple.
I will propose three different functions that will help you debug code inside chains of Pandas operations. Once you will see the idea behind them, you will be able to implement your own debugging functions.
Functions for debugging Pandas chains
All the functions I’m going to present below utilize the pd.pipe() function:
You can use pd.pip() to call — and use to a dataframe — any function that expects a Pandas dataframe or series. This opens us a range of possibilities: any such function can be added inside a chain of Pandas operations. And this is how we structure the functions below.
Debugging via breakpoint
Let me start with the most important function, and at the same time the simplest one. It that adds a typical breakpoint to a chain of Pandas operations:
def pdbreakpoint(d: pd.DataFrame) -> pd.DataFrame:
    df = d.copy(deep=True)
    breakpoint()
    return d
Simple, isn’t it?
You deserve the explanation why we’re creating a deep copy of the dataframe. If we didn’t done this, we would’ve risk that the original data frame would be returned. In our function, everything you do on the df dataframe does not affect the original dataframe, d. Hence, you can make changes to df and all will be fine. But you must not do any changes to d, since they will be reflected in the returned dataframe — and so the dataframe passed to further operations in the pipe would be done using this changed dataframe during debugging.
We will use the pdbreakpoint() function for the following Pandas pipe:
>>> d = pd.DataFrame(dict(
...     x=[1, 2, 2, 3, 4],
...     y=[.2, .34, 2.3, .11, .101],
...     group=["a", "a", "b", "b", "b"]
.. ))
>>> d = d.assign(xy=d.x + d.y).query("group == 'a'")
Certainly, it’s an overly simplistic example, but we don’t need a complicated pipe, as it could distract us from what interests us today: debugging. I used the d name for the dataframe for a reason; I wanted to use a different name from df, which I used inside the pdbreakpoint() function.
Remember that if you typically use df as a name for your temporary dataframes, you may consider using a name like d inside pdbreakpoint(). The choice is yours, but the only requirement is to use a name for the dataframe inside pdbreakpoint() that is not used in the outer scope.
Use a name for the dataframe inside pdbreakpoint() that is not used in the outer scope.
Now, suppose you want to inspect the d DataFrame after using the assign() function but before using the query() function. As mentioned earlier, you can achieve this by splitting the chain into two operations. Above, I demonstrated how to do this for Pandas code based on square brackets, and below, I illustrate how to do it for Pandas code based on chained operations:
>>> d = d.assign(xy=d.x + d.y)
>>> breakpoint()
>>> d = d.query("group == 'a'")
But this is something I have never liked doing. That’s why I came up with the pdbreakpoint() function. You can use it in the following way:
>>> d = (
...     d.assign(xy=d.x + d.y)
...     .pipe(pdbreakpoint)
...     .query("group == 'a'")
... )
The screenshot below shows what will happen:
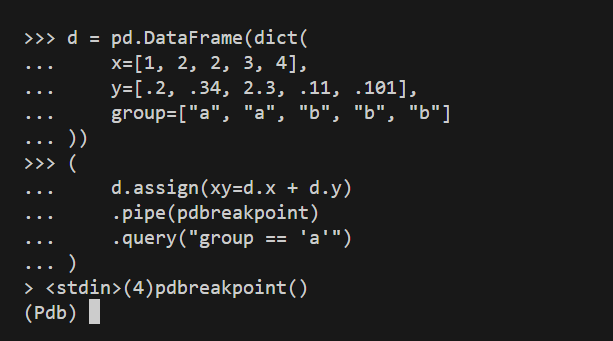
You’re inside the pdbreakpoint() function, and when you look at it once more, you will see that you will have access to a df data frame — which is the dataframe after running assign() and before running query() on it. Look:
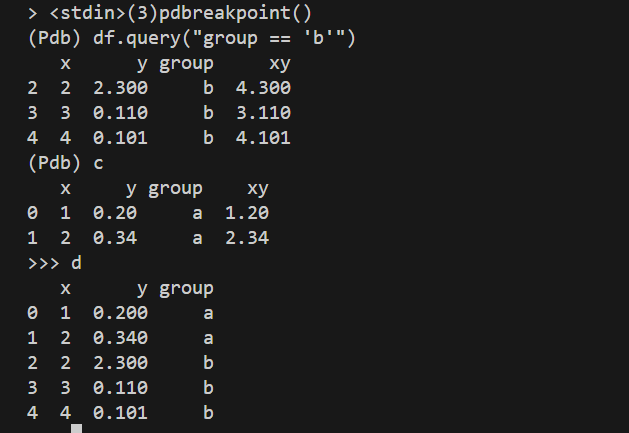
So, we inspected df inside the breakpoint; when doing so, we ran df.query("group == 'b'"). However, after hitting c (for continue), we returned to the regular session and obtained the final result, which is the data frame after running query("group == 'a'"), that is, after running the whole chain of operations on the d dataframe.
That’s it! This is a very simple way of inspecting Pandas data frames using the pdb built-in Python debugger.
Now that we know how to implement such functions, we can use this knowledge to implement other functions, ones that can help us debug Pandas chained operations.
Printing the head of a data frame
Our next function will not use the pdb interactive debugger. Instead, it will simply print the head of a data frame, with the possibility of selecting a subset of columns:
def pdhead(
    df: pd.DataFrame,
    n: int = 2,
    cols: Optional[Sequence[str]] = None,
    **kwargs
) -> pd.DataFrame:
    if cols:
        print(df.filter(cols).head(n), **kwargs)
    else:
        print(df.head(n), **kwargs)
    return df
Let’s see the code in action:
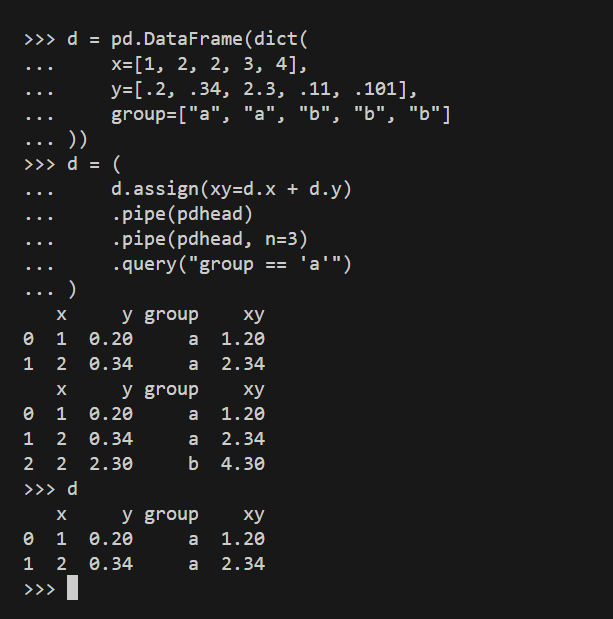
To show how pdhead() works, we used it twice — although in real life, you would never use this function twice in a row. The first time, we used it without n (so, with the default n value of 2), and the second time with n of 3.
You can see the function works as expected. The screenshot below shows how pdhead() works with the cols argument:
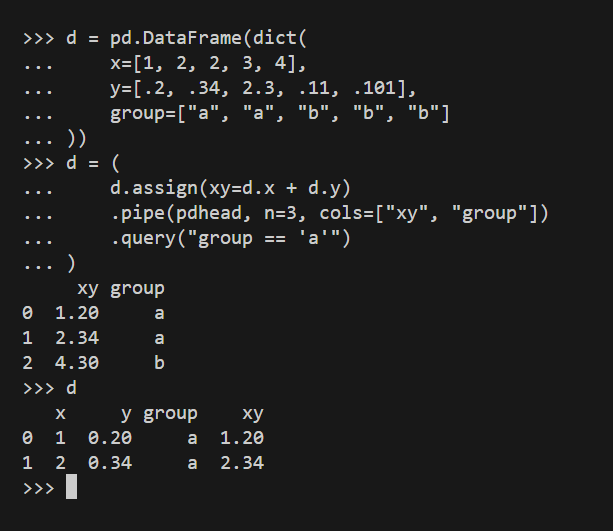
So, cols comes as handy when you want to see the dataframe with only selected columns. Here, we used both arguments, n and cols, and we saw the first three rows of a copy of the d data frame, with two columns: xy and group.
As you may have noticed, xy was created within this very chain of operations, which does not pose any problems, as the temporary version of the dataframe for which we used pdhead() already contained this column.
You can easily reimplement the function to show the tail of a dataframe, or to show the selected part of the dataframe: a subset of columns and/or a subset of rows. I’ll leave this to you as an exercise.
Do something inside a chain
This time, I will present a general function that will enable you to do whatever you want inside a chain of Pandas operations:
def pddo(
    df: pd.DataFrame,
    func: callable,
    usedf: bool = True,
    *args, **kwargs
) -> pd.DataFrame:
    if usedf:
        func(df, *args, **kwargs)
    else:
        func(*args, **kwargs)
    return df
This function is slightly more complex than the previous ones. It has two different use cases. Regardless of your intended action for the inspected dataframe, it must be reflected in the callable func(). You can use both positional and keyword arguments for this purpose.
Use case 1: Do not use the data frame. In that case, set usedf to False. For example, you can print a flag:

or the current date and time:

You can also log information— but remember that with usedf set to False you don’t have access to the data frame. If you require access, you’ll need to set this argument to True, and the next use case is all about it.
Use case 2: Use the data frame. More interesting use cases involve accessing the dataframe. Let’s start with some simple examples:
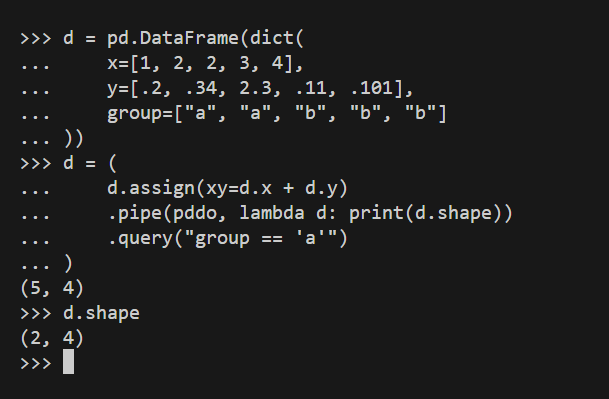
As you can use, when usedf is True (which is the default value of pddo()), you can use the dataframe. It’s used as the first argument to func() — and you can’t change that as otherwise pipe() would break down.
You can, in fact, perform quite advanced operations using pddo():

The foo() function performs quite a complex chain of operations and prints the result. Still, once pipe() calling pddo() (which calls foo()) returns, the original chain returns to the state before the pipe() function was called.
What you need to remember that if you want something to be printed, you need to directly call the print() method. Actually, you can implement your own function in which you don’t need to call print() — I will leave you this as an exercise. However, such a version could be used only for printing while the current version of pddo() is more general, because you can, for example, log the dataframe to a logger.
Conclusion
We have explored debugging chained operations using self-defined functions. The most crucial function is pdbreakpoint(), as it enables you do use pdb, the built-in interactive Python debugger. The other functions employed static debugging, but some of them could be used also for other purposes, such as logging.
You can expand this set of functions for debugging Pandas operations. They can be helpful for debugging pipes of these operations when you need to inspect the state of a dataframe at a specific point, without breaking the chain into separate statements.
Now that you know the concept, you should not have problems with implementing your own functions. Nevertheless, my suggestion is not to overdo with them. We’re talking about debugging, and I’d consider having to choose from a dozen or so functions to debug Pandas code a distraction rather than help.
To be honest, I myself use only the pdbreakpoint() function, but I wanted to share you with idea concept rather than just one function— so that you can choose your own approach to debugging. As I discussed in my previous Towards Data Science article on debugging in Python, I’m a great fan of the pdb interactive debugger, and I rarely need to use anything else. But this doesn’t mean that other approaches are not equally useful, at least in certain situations.
Thanks for reading. If you enjoyed this article, you may also enjoy other articles I wrote; you will see them here. And if you want to join Medium, please use my referral link below: