
How to Protect Your Wealth
Asset Allocation the Simple Way
Investing is simplest at the beginning.
Once you learn about things like investment accounts and index funds, you’re ready to get started stashing your money away to grow.
Because you have time on your side, are making regular contributions, and aren’t withdrawing any money, you don’t need to pay much attention to what’s happening to the market.
As we’ve looked at before, the market could crash a few years into your investing career and chances are you’d be fine in the long run.
But everything changes when you stop putting money in and start taking money out.
All of a sudden, the market’s volatility has the potential to rob you of your hard-earned nest egg. How can you protect your portfolio from the frightening specter of a bear market?
It starts with understanding why the market’s volatility is such a problem.
Sequence of Returns Risk
The scourge of the retiree is known as sequence of returns risk.
It sounds like a boring concept, but it’s critically important to understand. Let’s break down where it comes from and how it can sink your retirement.
A Simplified Example
To illustrate the math, we’re going to look at a simplified example I borrowed from Michael Kitces.
Imagine you have a nest egg of a million dollars. The next two years the market returns -50% and 100%. As long as you don’t put any money in or take any money out, the order of these returns doesn’t matter.
See for yourself:
Scenario 1 (Good Returns First)
- Year 1: $1,000,000 +100% = $2,000,000
- Year 2: $2,000,000 -50% = $1,000,000
Scenario 2 (Bad Returns First)
- Year 1: $1,000,000 -50% = $500,000
- Year 2: $500,000 +100% = $1,000,000
If you cut something by 50%, it’s the same as multiplying it by .5. If you increase something by 100%, you are doubling it (i.e. multiplying it by two). The order never matters, because the commutative property of mathematics says that when it comes to multiplication, the order is irrelevant:
- 2 x .5 = 1
- .5 x 2 = 1
But if you are adding or taking away money, the order starts to matter.
Lets say you take out $500,000 after the first year. Here’s how the math works now:
Scenario 1 (Good Returns First)
Year 1 Returns: $1,000,000 +100% = $2,000,000
- Withdrawal: $2,000,000 — $500,000 = $1,500,000
Year 2 Returns: $1,500,000 -50% = $750,000
Scenario 2 (Bad Returns First)
Year 1 Returns: $1,000,000 -50% = $500,000
- Withdrawal: $500,000- $500,000 = 0
Year 2 Returns: 0 +100% = 0
Simply switching the order of returns has yielded a $750,000 difference in your portfolio after two years. But it’s worse than that. In the bad scenario, you portfolio is completely depleted and has no capital to recover.
Again, this is an extreme and simplified example. But it illustrates an important point: The order you experience returns matters a great deal.
The Problem With the Stock Market
Let’s look at what happened to the stock market over the last 25 years.
The S&P 500 index, which tracks 500 of the largest publicly traded companies in America, was valued at 620.73 at the start of 1996. By the end of 2020, it was 3,732.04.
This is the same as an annualized return of about 7.44%:
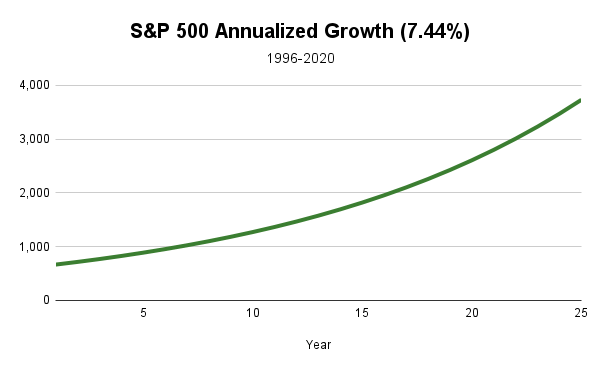
The problem with this picture is that it’s a lie. Or at the very least, an oversimplification that leaves out key details.
Here’s what actually happened to the market during that time frame:
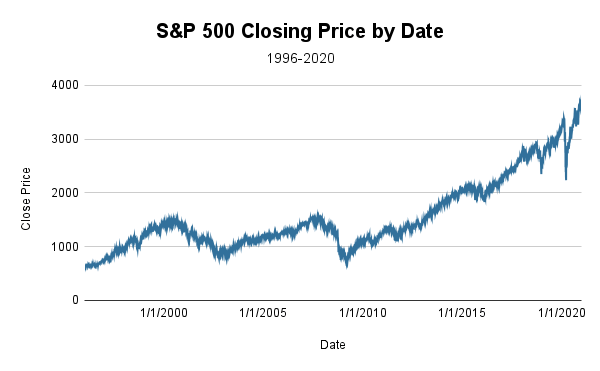
Both these charts start and end in the same place, but how they get there is very different. And how they get there matters.
Because if our returns were predictable, there would be no risk. If you knew you’d get 7.44% per year forever, you would just withdraw some amount less than that and your portfolio would keep growing forever as you continued to spend.
The Good News
Historically, most portfolios of retirees do continue to grow, even when subjected to the chaos of market volatility. Sequence of returns risk can sink your portfolio, but in some cases it can help you and in others it doesn’t make much difference.
Let’s imagine that you retired twenty-five years ago in 1996. In that time, the market has seen:
Two major Bull Markets
- The “dot-com boom” of the late 1990’s
- The entire decade of the 2010’s
Two major Bear Markets
- The early 2000’s “dot-com bust”
- The 2008 market crash and financial crisis
There was also what we could call the “Covid Crash” of March 2020, but the market fully recovered before the year ended.
Suppose you started with a million dollars and have been withdrawing $40,000 at the beginning of every year. Here’s what would have happened to your portfolio:
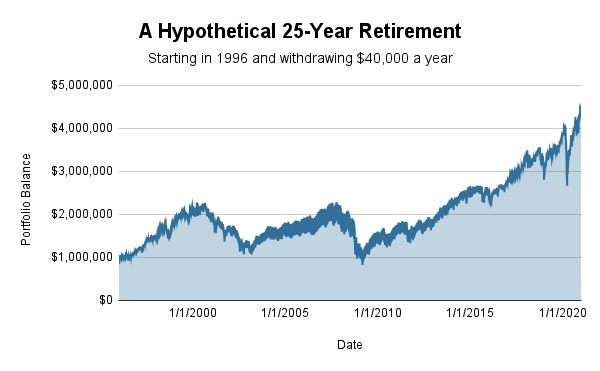
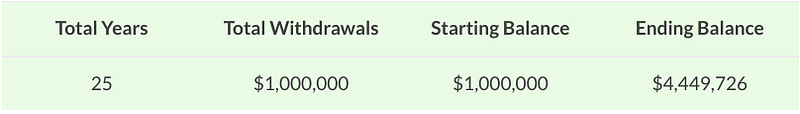
It’s almost unbelievable. Consider these facts:
- You started with a million dollars
- You spent a million dollars
- Instead of having nothing, you have nearly four and a half times your original balance
And that was after going through two brutal stretches in your first fifteen years.
Things are a little worse if you retired in 2000, but still pretty good:
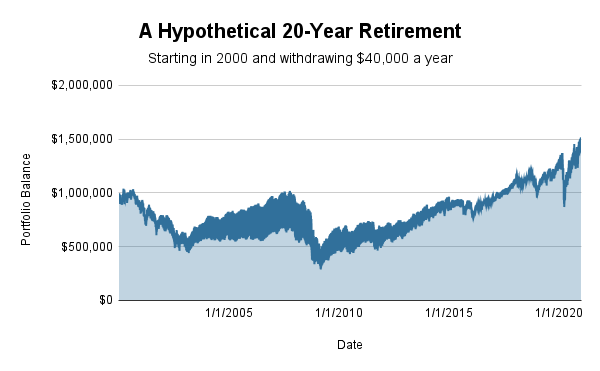
You still end up with more than you started with, which is amazing. And you do this despite retiring just before a bear market, which is the worst time to retire.
But the bull market of the 2010’s was unbelievable. It saved you in a major way.
The thing to pay attention to here though, is the fact that your portfolio was cut in half twice. When your portfolio is halved, there is less capital to generate returns. Also, each withdrawal hurts twice as much because it’s a larger percentage of your balance.
These are the situations where your portfolio could easily fail unless magnificent returns come in to save the day (which they did in real life)
The Problem in Plain English
Now that we’ve run the numbers, let’s pull out the most important principle. Here’s the biggest risk to your ability to retire, stated as simply as possible:
If the market crashes shortly after you retire and doesn’t rebound quickly enough, you might run out of money.
This isn’t likely, but it also isn’t impossible.
This is the scenario you have to guard against if you want your money to last for the rest of your life.
Diversification of Assets
So how do you protect yourself? By diversifying.
I advocate getting started with investing by putting your money into low-cost, total stock market index funds. These funds are already diversified in two ways:
- They are diversified across many companies
- They are diversified across many industries
But they aren’t diversified across asset classes. All your money is in the exact same asset class: Domestic stocks.
And as we’ve seen, domestic stocks are subject to market volatility, the force behind sequence of returns risk.
So as you begin to think about protecting your money, you need to start thinking about diversifying across asset classes.
Statistics, The Simple Way
In order to identify asset classes that are good complements to stocks, we need to know some basic statistics. There are just two terms we need to review: correlation and standard deviation.
Correlation
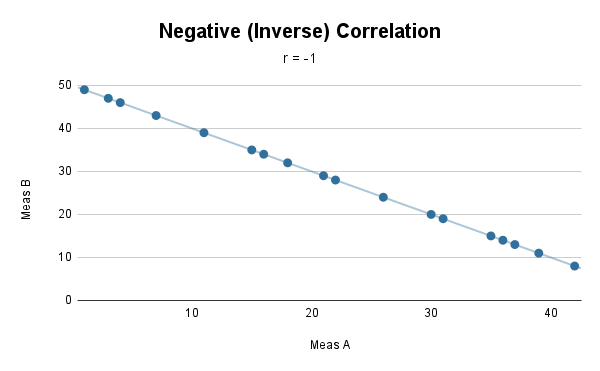
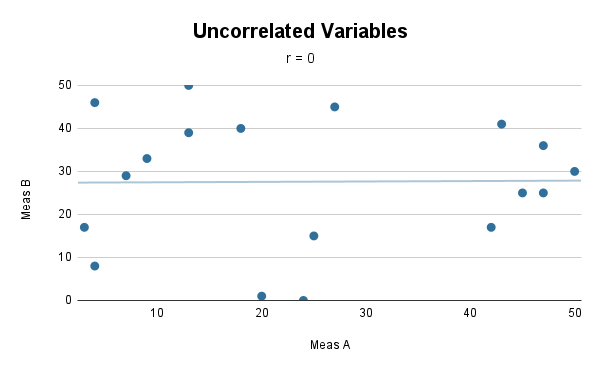
Correlation is one way of talking about the relationship between two variables. Does one go up when the other goes up? Does one go down when the other goes up? Do they not seem to be connected at all?
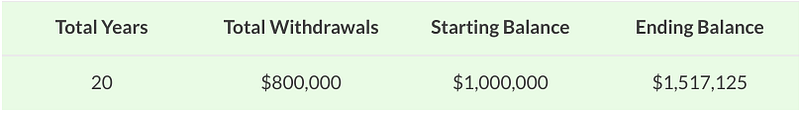
Correlation is expressed as a number between negative one and one and is abbreviated “r.”
- r = 1 means the variables are perfectly correlated, the rise or fall in lockstep
- r = -1 means they are inversely correlated, they always move exactly the opposite way
- and r = 0 means they are uncorrelated. There is no relationship between how they move
The closer to one or negative one the correlation is, the stronger the relationship between the variables. The closer to zero, the weaker the relationship.
Standard Deviation
Standard deviation is a way of measuring how spread out your observation are.
- A higher standard deviation indicates results that are more spread out
- A lower standard deviation indicates results that are less spread out
Look at these two charts. Both have 20 observations that average out to 7, but the one that is more spread out has a higher standard deviation:
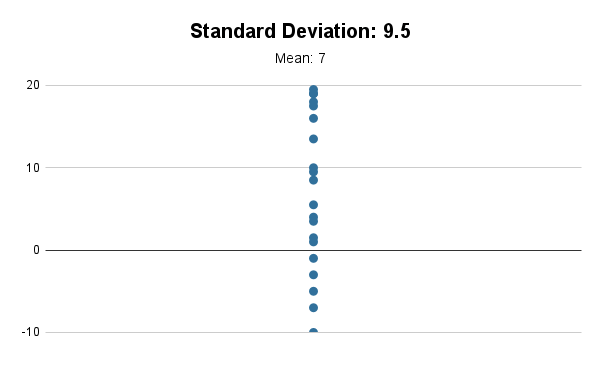
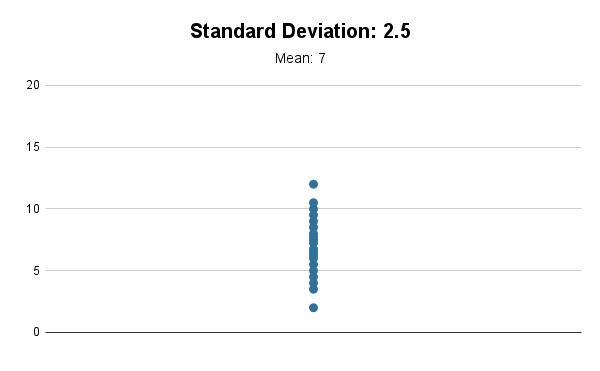
We can expect about 68% of our observations to be within one standard deviation from the mean.
So for this chart with the standard deviation of 2.5, one standard deviation is the range between 4.5 and 9.5 (the mean minus the standard deviation and the mean plus the standard deviation). We should expect about 68% of those dots to be between 4.5 and 9.
Evaluating Asset Classes
Let’s take those two terms we just learned from statistics and apply them to four major asset classes:
- Domestic Stocks
- International Stocks
- Bonds
- REIT’s (Real Estate Investment Trusts)
There are other asset classes out there, but for the sake of time, we’re covering these four. I’m not saying that your portfolio needs to contain these four and nothing else, but there is a portfolio called the Rick Ferri Core Four created by a user of the Bogleheads forum that is made up of these assets.
I ran the numbers for four asset classes for the time period of 1996–2020 that we’ve been looking at. Here’s a summary table:
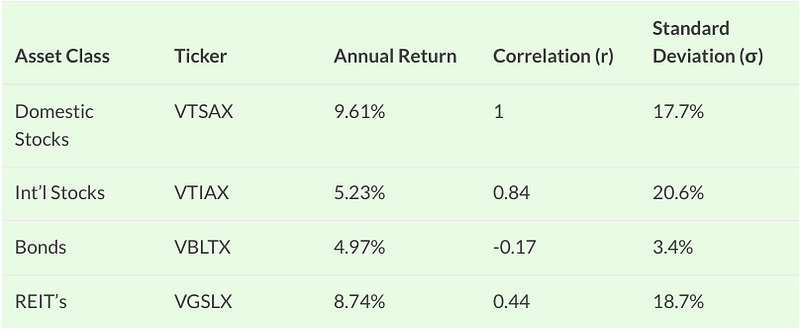
A few clarifying points before we analyze what all this means:
Correlation With What?
The correlation listed on this table is correlation with domestic stocks. That’s why you see r=1 on the first row. The relationship of an asset with itself is always a perfect positive correlation.
A Note on Ticker Symbols
I’ve included the ticker symbols of some actual Vanguard index funds. The data I pulled actually comes from these funds specifically.
These funds come in two classes:
- Investor Shares which have a lower minimum investment and higher expense ratio
- Admiral Shares which have a higher minimum investment and lower expense ratio
If you’re just getting started, you might have to start with the investor shares:
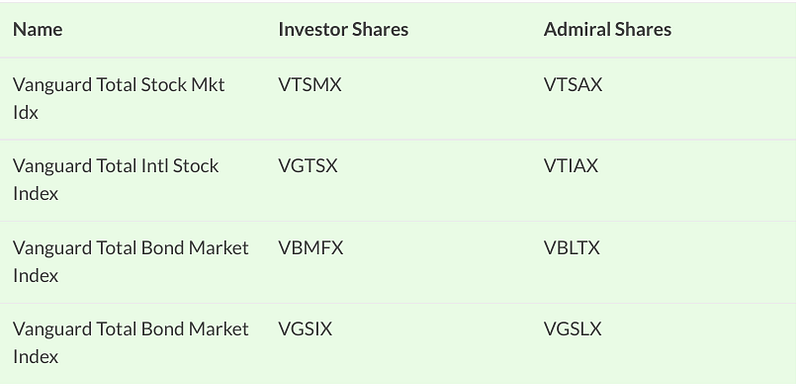
But it’s worth remembering that a lower expense ratio is always better.
Analyzing Stocks
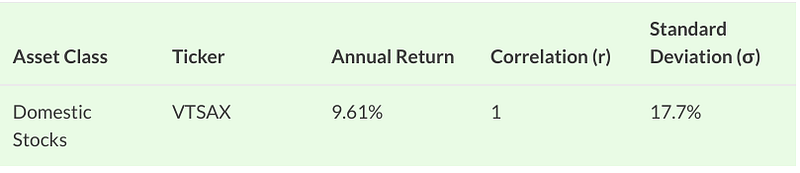
The reason why stocks are such a great investment is because of their excellent returns. In the period we’re looking at, stocks had an annualized return of 9.61%, the highest of all the asset classes.
The problem with stocks is the high standard deviation. Over our sample, we observed a whopping 17.7%.
Since the simple average of the returns during this time period was 11.2%, we can subtract and add 17.7% to find the range that equals one standard deviation from the mean:
- 11.2% — 17.7% = -6.5%
- 11.2% + 17.7% = 28.9%
In other words, around 68% of our observed returns were between -6.5% and 28.9%. That’s a pretty big range, and the low end is in the negatives.
Analyzing Bonds
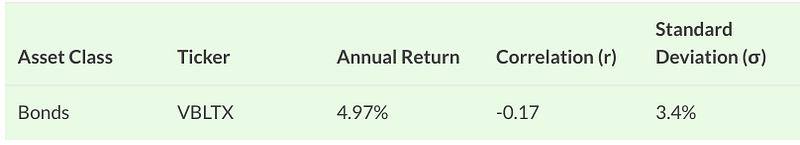
While stocks had the best returns, bonds had the worst returns.
But they make up for it by being strong in the other two areas. The standard deviation is small and the correlation with stocks is close to zero which is exactly what we want to see.
Here’s how they compared to stocks during the last 25 years:
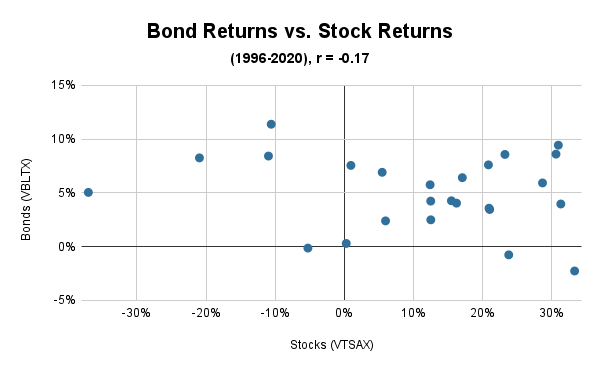
You’ll notice that in many of the years when stocks were negative (the left side), bonds were positive (the top left). This is exactly what we want.
It’s also nice that there aren’t many years where great stock returns were being hamstrung by negative bond returns (the bottom right).
The most encouraging dot on this whole chart is the one all the way to the left. On all these charts the leftmost dot is 2008, the worst year for stocks in our data set. If there was ever a year where you hoped the non-stock portion of your portfolio was positive, that was it.
The other thing to note here is that bonds had the fewest negative results in our data set. That’s very helpful when you’re talking about reducing risk.
Analyzing International Stocks
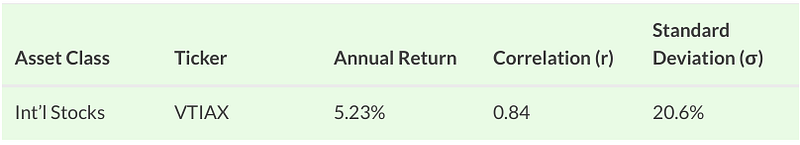
The two big problems here are the correlation and standard deviation.
International stocks have been highly correlated with domestic stocks, but the big difference has been that they’ve been more volatile.
Ouch.
Here’s what a correlation of 0.84 looks like in practice:
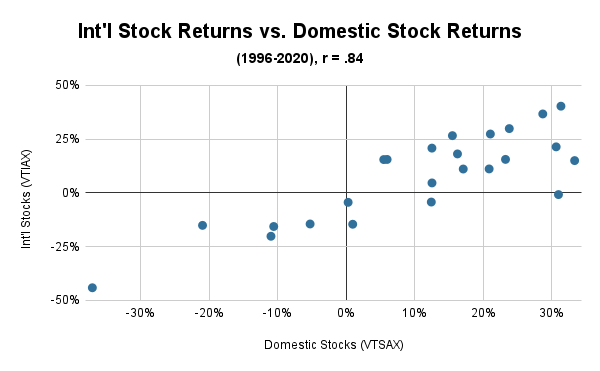
Every time domestic stocks have been negative, international stocks have been negative as well.
In 2008, domestic stocks dropped 37%, but their international counterparts dropped 44%.
Analyzing REIT’s
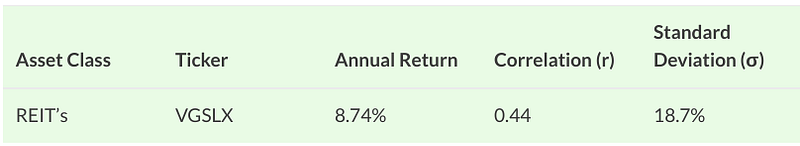
The return is great, the correlation is okay, and the big weakness is the 18.7% standard deviation. That’s higher than domestic stocks.
Here’s the visual of how REIT’s have performed against stocks over the past quarter century:
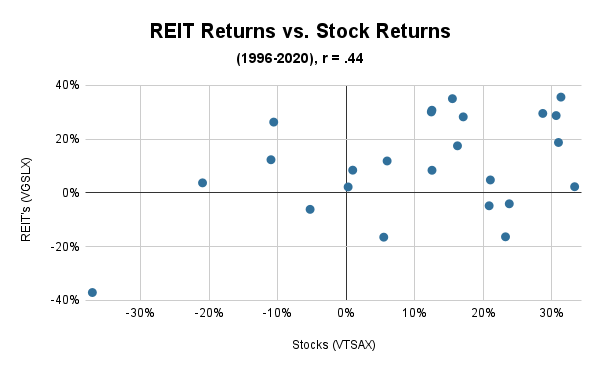
In 2008 stocks went down 37% and REIT’s went down…37%.
Why Bonds Are Best
We’ve seen that bonds are the best when it comes to standard deviation and correlation to stocks, but the worst when it comes to returns.
So where do they rank overall?
As far as I can tell, bonds are the single best complements to stocks.
It’s important to remember why we’re allocating our money across different asset classes in the first place.
Our primary goal is not to maximize returns, but to minimize risk.
If our primary goal was to maximize returns, we’d just go all-in on stocks and not worry about allocating.
When it comes to picking a complement for stocks, we want an asset that’s strong where stocks are weak. This means we need an asset with a low standard deviation.
We also need for its correlation to stocks to be close to zero.
It might seem like negative correlation is what we want, but it isn’t really. As volatile as stocks are, they still go up most of the time. If we had an asset that went down every time stocks went up, we’d be shooting ourselves in the foot. All of our gains from stocks would be erased by losses in the rest of our portfolio.
Why Not 100% Bonds?
If Bonds have historically been the safest choice, why not go all-in on bonds?
Well, you can if you want to, but it’s not something I’m seriously considering. There are two main reasons.
First, while returns are the least important factor in choosing a complement for stocks, they’re pretty important overall. During your wealth accumulation phase, they’re the most important variable.
Historically they’ve done well enough that they may have been a good, safe option for the only asset in a portfolio but…
There are some questions about bond returns going forward.
Simply put, the value of bonds depends heavily on interest rates. Higher interest rates are good for bonds, lower interest rates are bad.
And as I’m writing this interest rates are at or near rock-bottom levels.
For a long time I figured that I would transition from an all-stock portfolio to one that only featured stocks and bonds, but I’m questioning this now. Which leads to the next point:
There is No Perfect Asset Allocation
Like everything else in investing, the big problem here is that we can’t predict the future.
All we can do is come up with an asset allocation that is based on sound principles.
There are lots of portfolios that have been created over the years. Some use asset classes that we haven’t even talked about. For instance, the “Permanent Portfolio” features gold.
All of these asset allocations can help mitigate your risk, but none is guaranteed to be optimal.
The Most Important Variable
We’ve covered the fact that you need to pick which asset classes to use, but you also need to decide how much of your portfolio to add to each class.
It’s helpful to think of your portfolio as two buckets: stocks and non-stocks.
So you could think about a 60/40 split where 60% of your money is in stocks and 40% is in something else. The more you have in stocks, the riskier your portfolio is (but the higher your expected return is).
So if you have a portfolio split the following ways:
- Domestic stocks: 25%
- International Stocks: 25%
- Bonds: 25%
- Gold: 25%
You’d have a portfolio with a 50/50 split.
Rebalancing: Buy Low and Sell High
To maintain your asset allocation, you’ll need to occasionally rebalance your portfolio. This is because uneven returns will throw the percentages out of whack.
Luckily, rebalancing forces you into a buy low, sell high transaction and sets you up for future success.
As an example, let’s look at what would have happened if you had a million-dollar portfolio at the start of 2008.
If your money was in all stocks, you would have lost over 37% and your portfolio would have been depleted to $629,600 by the end of the year.
But here’s what would have happened if half your portfolio was in stocks and the other half in bonds:
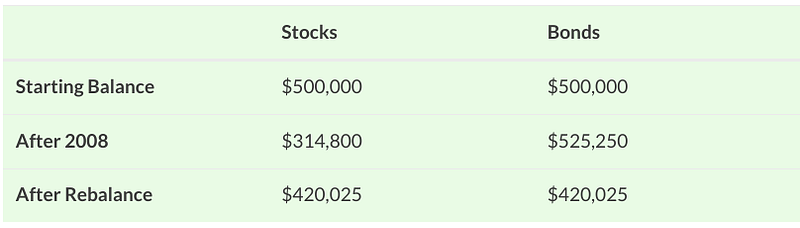
Not only is half your money protected from the downturn, half your money actually makes money. Instead of $629,600, you have $840,050 after a devastating crash.
And it gets better.
When you rebalance, you sell bonds (which did well) and buy stocks (which did poorly). You’re exposing more money to the potential recovery.
There is more to say about rebalancing, but it will have to wait for a future post. The important thing is that it is both necessary and helpful.
Final Thoughts
There are always risks in investing and the optimal strategy is only obvious in hindsight.
That doesn’t mean you should throw your hands in the air and decide to do nothing. With a little understanding of the principles we’ve covered, you can create a robust portfolio that can weather terrifying financial storms.


