Tools — Medium Earnings Chrome Extension
Easily Export Earnings
Medium Earnings Leaps to 1.5

The Medium Earnings extension for Chrome makes your life a bit easier yet again. Some exciting new things are included in this release:
- Export as Excel (🎁 new)
- Quick overview of your previous months (🎁 new)
- Monthly earnings in the table(🧬 improved)
- Read times in human-readable format (🧬 improved)
I tried to come up with a clever name for this extension. It was February, and I thought about the heap of puns I could do with leaping.
One small step for man, one giant leap for the extension
Sadly, there is no Leap Day this year. Luckily, I had Anthony Lawrence (Pcunix) coming to the rescue. He suggested ‘Excelsior’. What an excellent suggestion! The man really excels at everything, doesn’t he?
Now that I have expended my full repertoire of excel-jokes, shall we leap into the details?
Export as Excel
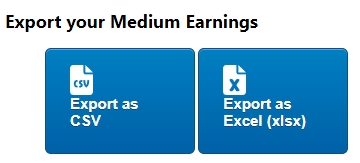
The previous versions of the extension allowed you to export all of your earnings to an comma-separated file. While this is nice, you do have to be a little bit tech-savvy to use this. Now you can export to excel as well!
I had already laid the foundation for this feature some time ago, but I wasn’t able to find time to actually include it in a release. When you click on the button, your earnings are exported as an excel-file. No more hassle to fix your worksheet before you start creating your pivot-tables.
For now there is only an option to download the file with the same contents as the csv. Future updates might include some advanced tables as well, like the export of the tables as you see them in the extension itself, or allowing you to choose which columns to export. And maybe some different formats, like pdf’s as well.
Time to develop the extension hasn’t been on my side the last couple of weeks, so it might take a while for those improvements to hit a release. Let me know in the comments if you’re yearning to see improvements here.
Also, let me know how you use the exported data. Maybe even write a story about it? I’m very curious about your the tables and graphs you cook up. I’d appreciate a mention so I don’t miss it.
Monthly Earnings
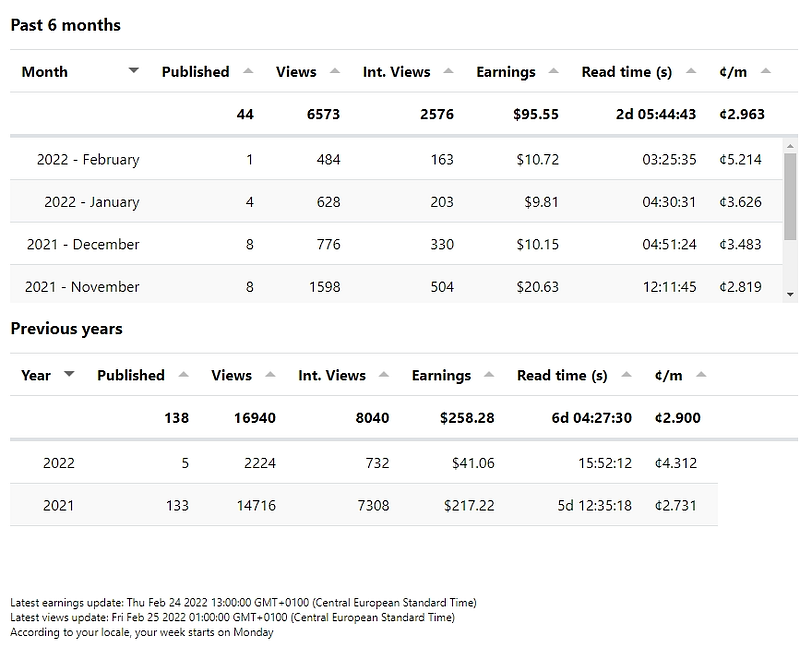
I figured that if you fire up the extension, you main concern is how you’re doing at that moment. To support this, a new table shows the six previous months when you open up the earnings page.
Why 6 months? Again, it comes down to performance. Parsing the data for 6 months can take up to half a second. While this may not seem much, it can really add up if you have been writing for quite some time. Also, the graph on the overview-screen also shows 6 months. This seemed consistent to me.
And, if you want to dive deeper, you can always look at the table:
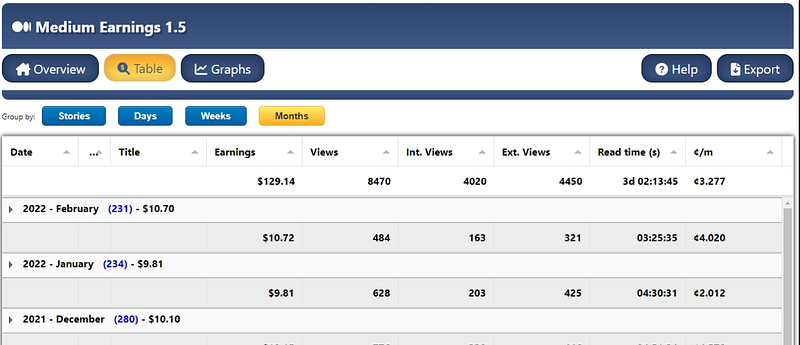
A new option has been added: group your earnings by month. This table shows you everything from times past. Want to go back a few years? The table’s got you covered! And, as usual, you can get more details by expanding the rows to look at how you did each day.
By the way, I have been experimenting with how the monthly-rows should be expanded. I am considering to add an option that allows you to look at the data on a per-story basis (instead of per-day). Can’t wait? Let me know in the comments?
Read Times Become Readable again
Ouch, this one comes up a lot in the release notes. It’s only been a short time ago that I changed the read times to seconds. My intention was to make the data easier to read and to compare. I received some feedback about it: it’s hard to compare numbers if the numbers themselves don’t mean a lot to you. So we’re back to days, hours, minutes and seconds.
Check out the screenshot in the previous paragraph if you want to see it in action.
Do note that the export still contains the seconds, not the formatted times. This allows for easier manipulation of data for those of us that want to apply excel-voodoo.
Known Issues
I have received several comments on how the ¢/m are calculated in the tables. I won’t go into detail here. There is a help-button in the extension for each section. Click on it to find out how the calculation works for stuff that is currently showing on your screen. I’ll probably update the behaviour sometime soon, for now you’ll just have to stick with this sub-par implementation.
You could always export your stuff to see the figures you’d like 😉.
Feedback
Want to say something nice or throw eggs at me? Eggcellent! I love suggestions. I can’t wait to hear from you in the comments.
Downloading/Installing/Updating
Installing is easy. First, make sure you have either Google Chrome or the Blaze browser installed. Then head over to the store using the link below and click on ‘Add to Chrome’ (or Blaze’s equivalent).
Already have the extension installed? Updates are installed automatically.
Awesomators
This group of wonderful people have supported the extension recently. Consider reading their stories:
Release History
Check out earlier updates here. Note that this might also be a good place to visit to check whether this is the latest version. This version was released on March 3, 2022.


