
Line Chart using React.js d3.js & TypeScript with the help of d3.bisector interaction — Part I
To create interactivity of the mouse following the plotted data there is a need to do a calculation of the closest point to the mouse. Luckily, d3 has a method d3.bisector that can help us with these calculations. In this two-part tutorial, I will show you how to work with d3.bisector.
In this first part, part one, I will be working with two linear scale values as the metric and in part two I will be working with value and time metrics using d3.bisector.
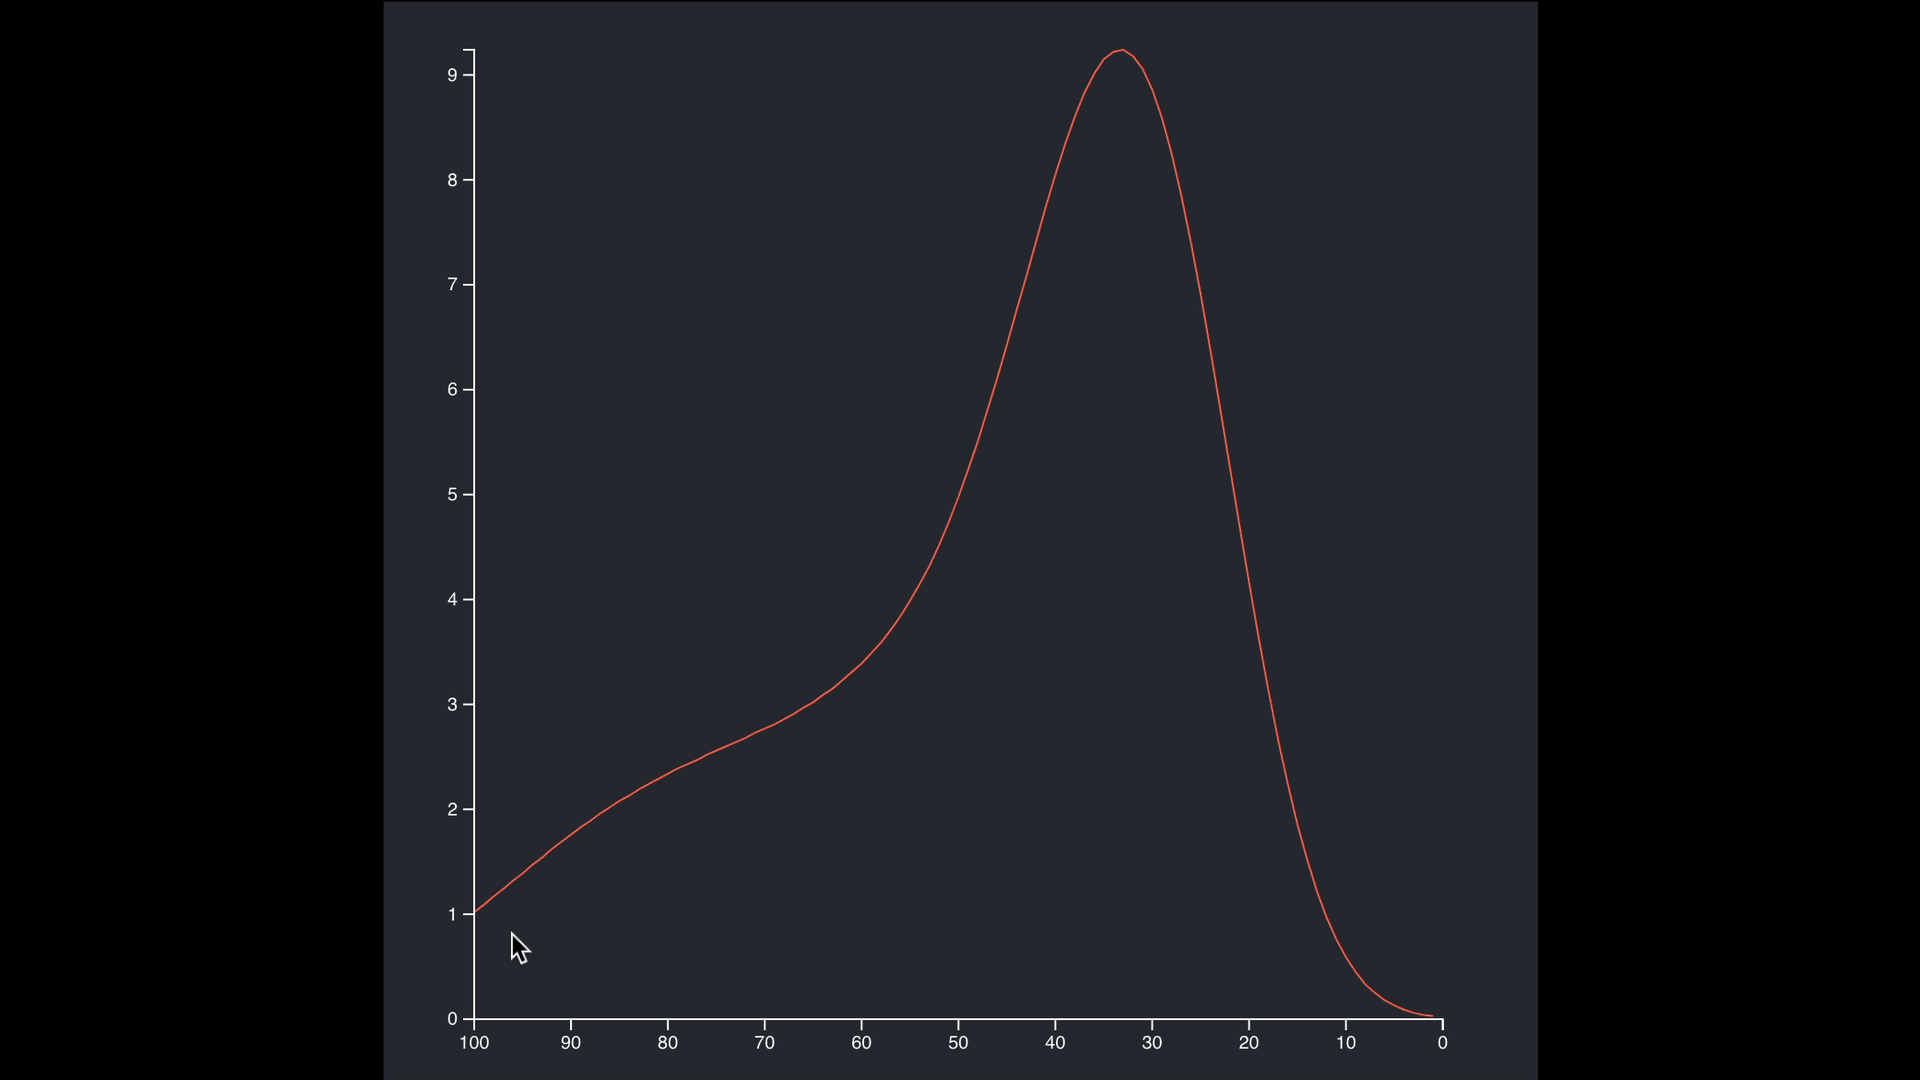
You can see the final result of this tutorial below;
Setting up your project
I will be using CRA (SPA) using the MHL template to get TS, SCSS, formatting, templates, linting, etc.
$ yarn create react-app bisector --template must-have-librariesAdd d3, d3-cloud and types;
$ yarn add d3 @types/d3data.csv
A good place to start when working with charts is from the data. The data is made out of three metrics: x, y values. We also have the date that it’s not being using in our code for now.
/public/data/line.csv
x,y,date
1,0.03,1/1/2021
2,0.04,1/2/2021
3,0.06,1/3/2021
4,0.09,1/4/2021
5,0.13,1/5/2021
6,0.18,1/6/2021
7,0.25,1/7/2021
8,0.33,1/8/2021
9,0.45,1/9/2021
...
To creating the components we will be using my templates;
$ npx generate-react-cli component LineChartBisector --type=d3WidgetComponent$ npx generate-react-cli component LineChartBisectorWidget --type=d3WidgetThese templates will create for you the following files we need;
- widgets/LineChartBisectorWidget/types.ts
- components/LineChartBisector/LineChartHelper.tsx
- widgets/LineChartBisectorWidget/LineChartBisectorWidget.tsx
- components/LineChartBisector/LineChartBisector.tsx
types.ts
Next, we want to set some types for TypeScript. The Data object matches the data.csv metric format by setting up the x and y values as the metrics. The Dimensions object will help us pass some props values from the widget to the actual chart components;
// src/widgets/LineChartWidget/types.ts

export namespace Types {
  export type Data = {
    x: number
    y: number
  }
  export type Dimensions = {
    width: number
    height: number
    margin: {
      left: number
      right: number
      top: number
      bottom: number
    }
    boundedWidth: number
    boundedHeight: number
  }
}
LineChartHelper.tsx
In the LineChartHelper, I am setting some of the classes with private members so the class can be set so we can change the data metrics that the chart will be using. Other members can be set as static so the helper doesn’t need to be initialized.
The helper includes the layout, setting up dimensions and scales, take a look;
// src/component/LineChartHelper/LineChartHelper.tsx

import * as d3 from 'd3'
import { Types } from '../../widgets/LineChartBisectorWidget/types'

export default class LineChartHelper {
  private readonly metric: string[]

  constructor(metric: string[]) {
    this.metric = metric
  }

  // @ts-ignore
  public xAccessor = (d: Types.Data) => d[this.metric[0]]

  // @ts-ignore
  public yAccessor = (d: Types.Data) => d[this.metric[1]]

  static getDimensions = (width: number, height: number, left: number, right: number, top: number, bottom: number) => {
    const dimensions = {
      width,
      height,
      margin: {
        left,
        right,
        top,
        bottom,
      },
      boundedWidth: 0,
      boundedHeight: 0,
    }
    dimensions.boundedWidth = dimensions.width - dimensions.margin.left - dimensions.margin.right
    dimensions.boundedHeight = dimensions.height - dimensions.margin.top - dimensions.margin.bottom

    return dimensions
  }

  static getScales = (data: Types.Data[], width: number, height: number, metric: string[]) => {
    const helper = new LineChartHelper(metric)
    return {
      xScale: d3
        .scaleLinear()
        .domain([
          0,
          d3.max(data, (d) => {
            return Math.max(...data.map(helper.xAccessor), 0)
          }),
        ] as [number, number])
        .range([height, 0]),
      yScale: d3
        .scaleLinear()
        .domain([
          0,
          d3.max(data, (d) => {
            return Math.max(...data.map(helper.yAccessor), 0)
          }),
        ] as [number, number])
        .range([height, 0]),
    }
  }
}
For the xScale and yScale, I am using a scaleLinear and the Math.max to calculate the value range.
LineChartBisectorWidget.tsx
The LineChartBisectorWidget is the parent component to hold the chart as well as any other elements that I need to interact with, for example, it can include other charts, lists, UI elements, and title elements.
The widget component loads the data and allows sharing the data between the components so no need for redundancy. This can be tight in with the data management library like Redux or Recoil.
I am also setting up a loader to make sure the data is loaded. This can be replaced with a spinner or anything you need.
The dimensions are set as a reference and WindowDimensions a hook is used to listen to resize events from the DOM. It’s set as a ref so it can be used inside the useEffect, without the function being called all the time.
// src/widgets/LineChartWidget/LineChartBisectorWidget.tsx

import React, { useEffect, useRef, useState } from 'react'
import * as d3 from 'd3'
import { Types } from './types'
import useWindowDimensions from '../../hooks/WindowDimensions'

import LineChartHelper from '../../components/LineChartBisector/LineChartHelper'
import LineChartBisector from '../../components/LineChartBisector/LineChartBisector'

const LineChartBisectorWidget = () => {
  const [data, setData] = useState<Types.Data[]>([{ x: 0, y: 0 }])

  const { width, height } = useWindowDimensions()

  const dimensions = useRef() as { current: Types.Dimensions }
  dimensions.current = LineChartHelper.getDimensions(width * 0.9, height * 0.9, 30, 50, 10, 20)

  // resize
  useEffect(() => {
    ((dimensions as unknown) as { current: Types.Dimensions }).current = LineChartHelper.getDimensions(width * 0.9, height * 0.9, 30, 50, 10, 20)
    // console.log(dimensions.current)
  }, [width, height])

  const loadData = () => {
    d3.dsv(',', '/data/line.csv', (d) => {
      return (d as unknown) as Types.Data[]
    }).then((d) => {
      setData((d as unknown) as Types.Data[])
    })
  }

  useEffect(() => {
    if (data.length <= 1) loadData()
  })

  return <>
    {data.length > 1
      ?
        <LineChartBisector dimensions={dimensions.current} data={data} propertiesNames={['x', 'y']} />
      :
        <>Loading</>}
  </>
}
export default LineChartBisectorWidget
WindowDimensions.tsx hook;
// src/hooks/WindowDimensions.tsximport { useState, useEffect } from 'react'
function getWindowDimensions() {
const { innerWidth: width, innerHeight: height } = window
return {
width,
height,
}
}
export default function useWindowDimensions() {
const [windowDimensions, setWindowDimensions] = useState(getWindowDimensions())
useEffect(() => {
function handleResize() {
setWindowDimensions(getWindowDimensions())
}
window.addEventListener('resize', handleResize)
return () => window.removeEventListener('resize', handleResize)
}, [])
return windowDimensions
}LineChartBisector.tsx
The LineChartBisector is the actual chart. Notice that I am creating: memoizedUpdateCallback with useCallback.
That way I can use them in multiple useEffects instead of copy-paste the code multiple times.
I keep track of data change, and the previous width and height of the document so I can redraw the chart on a resize event.
Inside memoizedUpdateCallback, I am drawing the chart and setting up the Peripherals.
Lastly, notice that I am setting most of the elements as JSX instead of adding them with d3 via append. d3 will append the text and circle once hover, but the rest is pure JSX.
// src/component/LineChart/LineChartBisector.tsx

import React, { useEffect, useCallback } from 'react'
import * as d3 from 'd3'
import { Types } from '../../widgets/LineChartBisectorWidget/types'
import LineChartHelper from './LineChartHelper'

const LineChartBisector = (props: ILineChartProps) => {
  const memoizedUpdateCallback = useCallback(() => {
    const scales = LineChartHelper.getScales(props.data, props.dimensions.boundedWidth, props.dimensions.boundedHeight, props.propertiesNames)
    const bounds = d3.select('#bounds')

    const helper = new LineChartHelper(props.propertiesNames)

    // draw chart
    const linesGenerator = d3
      .line()
      // @ts-ignore
      .x((d) => scales.xScale(helper.xAccessor(d)))
      // @ts-ignore
      .y((d) => scales.yScale(helper.yAccessor(d)))

    d3.select('#path')
      .attr('fill', 'none')
      .attr('stroke', 'tomato')
      // @ts-ignore
      .attr('d', linesGenerator(props.data))

    // Peripherals

    // yAxis
    const yAxisGenerator = d3.axisLeft(scales.yScale)
    bounds
      .select('#y-axis')
      // @ts-ignore
      .call(yAxisGenerator)

    // xAxis
    const xAxisGenerator = d3.axisBottom(scales.xScale)
    bounds
      .select('#x-axis')
      // @ts-ignore
      .call(xAxisGenerator)
      .style('transform', `translateY(${props.dimensions.boundedHeight}px)`)

    const bisect = d3.bisector( (d) => {
      // @ts-ignore
      return d.x
    }).left

    const focus = bounds
      .append('g')
      .append('circle')
      .style('fill', 'none')
      .attr('stroke', 'white')
      .attr('r', 8.5)
      .style('opacity', 0)

    const focusText = bounds
      .append('g')
      .append('text')
      .attr('fill', 'white')
      .style('opacity', 0)
      .attr('text-anchor', 'left')
      .attr('alignment-baseline', 'middle')

    bounds
      .append('rect')
      .style('fill', 'none')
      .style('pointer-events', 'all')
      .attr('width', props.dimensions.width)
      .attr('height', props.dimensions.height)
      .on('mouseover', mouseover)
      .on('mousemove', mousemove)
      .on('mouseout', mouseout)

    function mouseover() {
      focus.style('opacity', 1)
      focusText.style('opacity', 1)
    }

    function mousemove(event: React.MouseEvent) {
      const x0 = scales.xScale.invert(d3.pointer(event)[0])
      const i = bisect(props.data, x0, 1)
      const selectedData = props.data[i]
      focus.attr('cx', scales.xScale(selectedData.x)).attr('cy', scales.yScale(selectedData.y))
      focusText
        .html(`x:${  selectedData.x  }  -  y:${  selectedData.y}`)
        .attr('x', scales.xScale(selectedData.x) + 15)
        .attr('y', scales.yScale(selectedData.y))
    }
    function mouseout() {
      focus.style('opacity', 0)
      focusText.style('opacity', 0)
    }
  }, [props.data, props.dimensions, props.propertiesNames])

  useEffect(() => {
    memoizedUpdateCallback()
  }, [memoizedUpdateCallback, props.data])

  return (
    <div id="div">
      <svg id="wrapper" width={props.dimensions.width} height={props.dimensions.height}>
        <g id="bounds" style={{ transform: `translate(${props.dimensions.margin.left}px, ${props.dimensions.margin.top}px)` }}>
          <path id="path" />
          <g id="x-axis" />
          <g id="y-axis" />
        </g>
      </svg>
    </div>
  )
}

interface ILineChartProps {
  dimensions: Types.Dimensions
  data: Types.Data[]
  propertiesNames: string[]
}

export default LineChartBisector
I want to point few things in the code;
To find the closest X index of the mouse we can use the closest left or closest right:
    const bisect = d3.bisector( (d) => {
      return d.x
    }).left
We create the circle that travels along the curve of the chart using d3 and append it to the DOM, we could set it as JSX with visibility, but I am fine with adding it dynamically;
    const focus = bounds
      .append('g')
      .append('circle')
      .style('fill', 'none')
      .attr('stroke', 'white')
      .attr('r', 8.5)
      .style('opacity', 0)
the same with the text that travels along the curve of the chart
    const focusText = bounds
      .append('g')
      .append('text')
      .attr('fill', 'white')
      .style('opacity', 0)
      .attr('text-anchor', 'left')
      .attr('alignment-baseline', 'middle')
When the mouse move, recover the coordinate we need and show the annotations.
function mousemove(event: React.MouseEvent) {
      const x0 = scales.xScale.invert(d3.pointer(event)[0])
      const i = bisect(props.data, x0, 1)
      const selectedData = props.data[i]
      focus.attr('cx', scales.xScale(selectedData.x)).attr('cy', scales.yScale(selectedData.y))
      focusText
        .html(`x:${  selectedData.x  }  -  y:${  selectedData.y}`)
        .attr('x', scales.xScale(selectedData.x) + 15)
        .attr('y', scales.yScale(selectedData.y))
    }
Download the complete code: https://github.com/EliEladElrom/react-tutorials/
In terms of interactivity, I used this component in a project and I set a hover state for each word to be underlined, once the user clicks the word, I used the word to filter results.
App.tsx
On the entry point App.tsx, just include the widget;
// src/App.tsximport React from 'react'
import './App.scss'
import LineChartBisectorWidget from './widgets/LineChartBisectorWidget/LineChartBisectorWidget'
function App() {
return (
<div className="App">
<header className="App-header">
<LineChartBisectorWidget />
</header>
</div>
)
}
export default App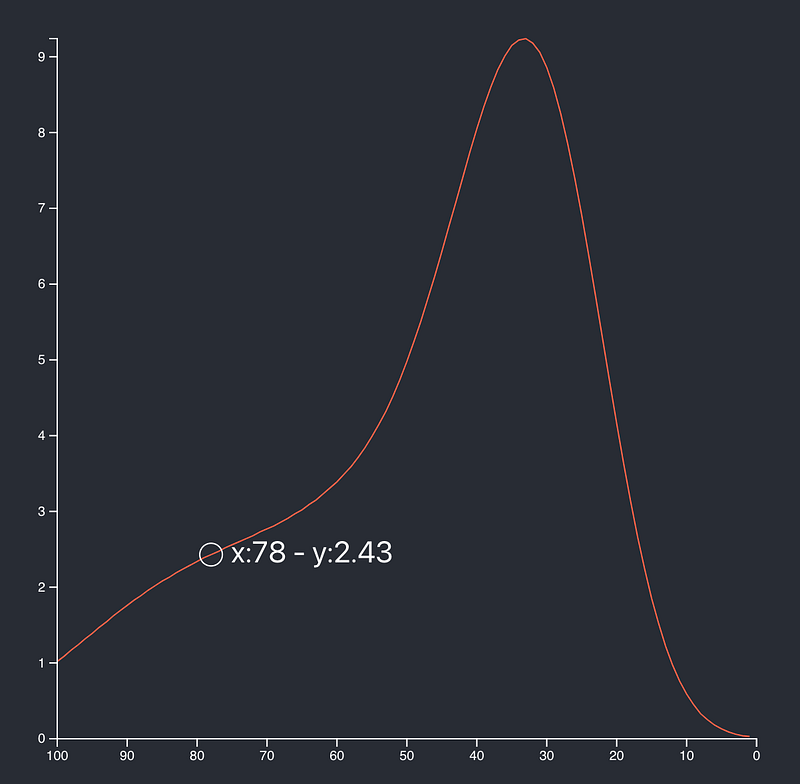
Summary
React and d3 are the two top libraries in their respective areas. Giving React control over the DOM with the help of memorizing methods and writing the elements as JSX, while letting D3 handle the heavy lifting for calculations and interactivity can help you get the best of both worlds and create great data visualization charts to help tell your story better.
Where to go from here
Need help with integrating React d3 project or learning? I am here to help.
- Take the React + d3 interactive course.
- Buy the d3 + React book.
- Read related articles: https://readmedium.com/setting-up-professional-react-project-with-must-have-reactjs-libraries-2020-9358edf9acb3
If you like this article, don’t be shy to clap 🙏✌


