
Download and Analyse Jira Data with Python, Pandas and Plotly
Learn how to connect to your Jira instance and download the data for advanced analytical processing in Python.
Jira is a great tool for agile project management and collaboration. It has a wealth of built-in reporting capabilities and it becomes even more powerful with various plugins. Nevertheless, there are certain situations where you want your Jira data to be available locally or in another system. For those cases, Jira offers a convenient REST API library.

Python is a easy-to-learn (and my favorite) programming language that allows you to quickly get things done. Together with Jupyter Notebooks, Python and Jira are the perfect match for a small and fun programming project over the weekend. In this article we will cover the following topics:
- How to establish a secure connection with Python to your Jira instance?
- How to download issue data?
- How to download board and sprint data?
- How to download project data?
- How to transform Jira data into a Pandas dataframe?
- How to visualize your Jira data with Plotly Express?
At the end of the article, you will find a link to the full Jupyter Notebook on github. Let’s get into it.
0. Prerequisites
Needless to say that you need to have access to Jira. For that Jira instance you must have an active API token. Find out how to generate one here. Also, you need a Python compatible IDE like Visual Studio Code that can run Jupyter Notebooks.
1. Understand the Jira Rest API
Jira provides various versions of their REST API. A good entry point is the official documentation for version 3 which is available here. A request towards Jira typically contains a URL. For searching Jira issues, the URL is as following (in case you are using Jira Cloud):
https://<your-jira-instance-name>.atlassian.net/rest/api/latest/searchThe above query will return all Jira issues that you have access to with your signed-in user. If you want to search for issues which fulfill a certain search criteria, you can add a JQL query string to your URL. In case your query returns thousands of results in the response, you need to make multiple calls since the maximum result limit is 1000 (for issues). To retrieve all issues (or other data objects), the URL must be called multiple times with an increasing startAt parameter.
Here is a variation of the above REST API call with a JQL search string as an additional parameter:
https://<your-jira-instance-name>.atlassian.net/rest/api/latest/search?jql=project=ABCDF%20AND%20issuekey=ABCD-298I prefer to not use out-of-the-box Python Jira libraries like this one but feel free to give those libraries a try as well. Instead, in this article we will build the necessary functions from scratch.
2. Establish a Connection to Jira
The first hurdle is to establish a connection to Jira using your API token, username and your Jira instance URL. This information should be stored in an .env file which can be read as following:
It is important that you construct the signature for your HTTP header in a proper way with the correct encoding. We will use the below function for all our upcoming calls to Jira. In essence, the function will create a signature and add it to the HTTP header. It then uses the Python requests library to get a response from the Jira server.
The function either returns an error or a response object.
3. Download Jira Issues and Epics
The most common use case is to search and download Jira Issues and Epics. Leveraging the function above, we will retrieve all Jira Issues (note: it will also return Epics as they are also considered a special type of Issue in Jira) like this:
The function expects an (optional) JQL query as an input parameter. First, it sets the start position to 0 and defines the block size to 100 (how many objects to fetch in one request). In production, you want to increase the block size to the maximum to reduce the number of calls.
Within the while loop, the HTTP parameters are defined. While the start position and the max results is needed, we only add a jql parameter in case we have one.
In line 11, we call the above helper function to establish the connection to the Jira server. The list all_issues is then extended with the response. In case the request does not return any objects, we know that we can exist the while loop by setting has_next to False.
At last, the Python list is transformed into a Pandas data frame. This data frame is returned by the function.
The data frame returned has the original Jira wording and contains many columns that we do not need. Therefore we remove unnecessary columns in line two and rename columns in line three of this code snippet:
At last, we will further improve the Pandas dataframe by merging it with the Epics. The resulting dataframe df_issues_enhanced is the basis for the data visualization in the subsequent chapters.
4. Download Boards and Sprints
The download of Jira Boards and Sprints is similar to what we have seen for Jira Issues. Here is the code to retrieve all Boards on your Jira instance:
Following is the code to retrieve all Sprints. Note that Jira requires a Board ID to retrieve the Sprints. There is no way to ask Jira to return all Sprints. Therefore, the function parameter board_id is mandatory.
5. Visualize Your Data
There are endless ways to visualize your data. Ploty offers a wide set of chart types. For the purpose of this article, we will go over a few basic visualizations. Please take it as an inspiration to create your own.
Show Storypoints Grouped by Issue Type
Purpose: As a program manager I want to see the total volume of work (in story points) per type or work (e.g. tasks, bug-fixing) so that I can better understand where the teams spent the majority of their time.
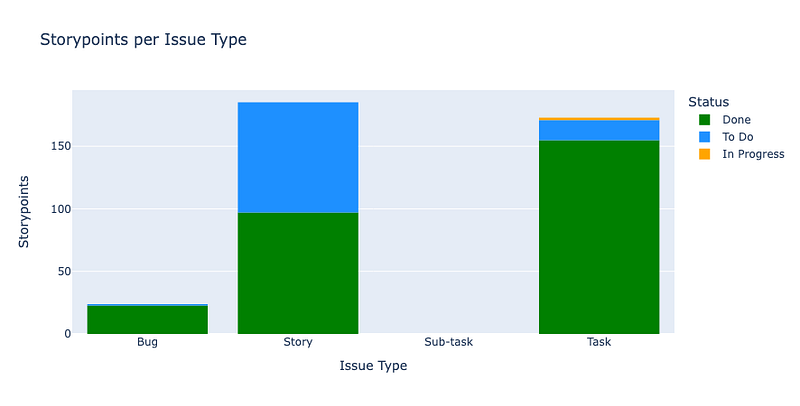
To generate the bar chart, we will use the Plotly histogram type to merge the different priorities into one color. For the underlying data we must create a new data frame df_issues_per_type. We will sum up the story points for all issues in the data frame df_issues_enhanced. Epics are excluded in the query.
Show Number of Issues Grouped by Issue Type
Purpose: As a program manager I want to see the total volume of generated work per type (e.g. tasks, bug-fixing) so that I can better understand the volume of work for each work type.
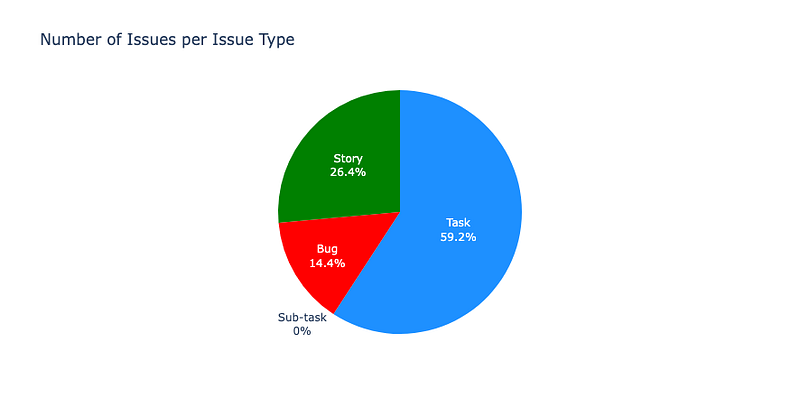
The pie chart is based on the same query that we have used to generate the bar chart above. We will assign distinct colors based on the type of issue. This time we will not use the sum of storypoints but the sum off issues (issue_count).
Show Volume of Work per Epic
Purpose: As a program manager I want to see the total volume of work (in story points and by ticket volume) for each Epic so that I can better understand on which features we spent most of our time.
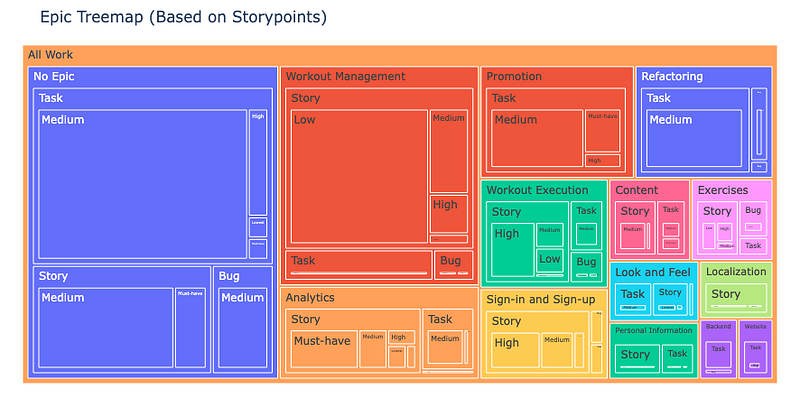
For the treemap, we need a new modified dataframe df_issues_per_epic that will aggregate the storypoints based on Epic names.
Show Current Progress per Project
Purpose: As a program manager I want to see the progress for each project by comparing story points for ongoing and already completed issues so that I can understand how much work is still ahead of us.
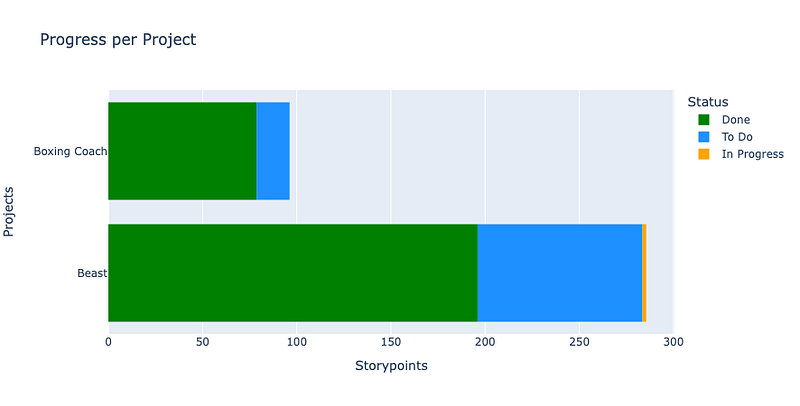
For this bar chart, we must group the data by project, therefore we will create a new data frame called df_issues_per_project.
Visualize Sprint Velocity
Purpose: As a program manager I want to see the total volume of work in story points completed in each sprint so that I can better understand the velocity of my team over time.
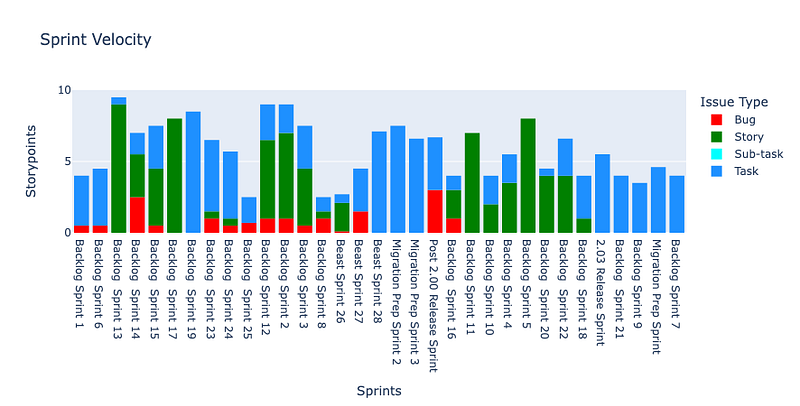
As we now need to access sprint related data, we will leverage the data frame df_issues_in_sprint. We must group the data by sprint to generate the above chart.
6. References
- Github repository containing the Jupyter Notebook with the full code
- Jira Cloud
- Plotly Express charts overview
Level Up Coding
Thanks for being a part of our community! Before you go:
- 👏 Clap for the story and follow the author 👉
- 📰 View more content in the Level Up Coding publication
- 💰 Free coding interview course ⇒ View Course
- 🔔 Follow us: Twitter | LinkedIn | Newsletter
🚀👉 Join the Level Up talent collective and find an amazing job


