
Don’t Start Using ChatGPT for Data Science Without Reading This!
With ChatGPT Prompts That were Tested Before!

Data Science, Data Science, Data Science. If you add some keywords at the end or beginning of this, I assure you, it will be clicked, every time. But how many of us actually know what it is? And how it can be enhanced, with ChatGPT?
What is Data Science?
Let me explain it, like I am a tech dictionary. Data Science is a multidisciplinary field, that contains bunch of different aspects, like:
- Data Exploration
- Data Visualization
- Machine Learning
and often used by someone, who has a prior knowledge of programming, statistics, and algorithms at least.
Data Science After ChatGPT
But of course, after ChatGPT, now the Data Science is evolving into another level.
If you are a Data Scientist or wanne-be data scientist, knowing ChatGPT, will give you at least 2 steps a head, trust me I’ve been there and I still am there.
Now in this one, let’s see how this actually will happen.

Data Exploration with ChatGPT

Now data exploration is actually a second phase of Data Science.
First one should be Web Scraping or Data Collecting. To do that, you can use ChatGPT and prompts too but I found it not so effective, because you can not do it on every page.
But if you want to know more about it, read this one.
Jobs and Salaries in Data Science

Okey, we are at the step 2, Data exploration. Now you have data and you should know more about it. Here is the data I am going to use;

Important Note : Since we are using ready dataset, we are skipping Data Manipulation step, which you should not if you have raw data.
Let’s see a prompt in action. You can modify this prompt according to your project need, but here are the 3 method in python that I am using most, as a Data Scientist.
Act like a data scientist, and you’re at the Data exploration step.
Use : info() , head() and describe() method, in addition to the method you will use.
( Use this technique while using describe() to be sure of selecting numerics,
.select_dtypes(include=['int64', 'float64']).describe() )
Here is the output.

As you can see, we now have a great opinion about our dataset. Next step will be Data Visualization.
Data Visualization with ChatGPT

Sometimes, seeing the data will be more beneficial for you to catch the trends, or you might say :
A Picture is Worth a Thousand Words.
I don’t know who said that but it is true. But in your dataset, which graph you should see? You might know that, some graphic types might not good for you.
I want to know more about [X].
And here is the result of the .info() of my dataset.
Which graph should I use, on [Y]
Now, let’s use the following prompt for our data.
I want to know more about salary, how it changes?
And here is the result of the .info() of my dataset.

" Here I added results, that I got from the previous steps output of info() method"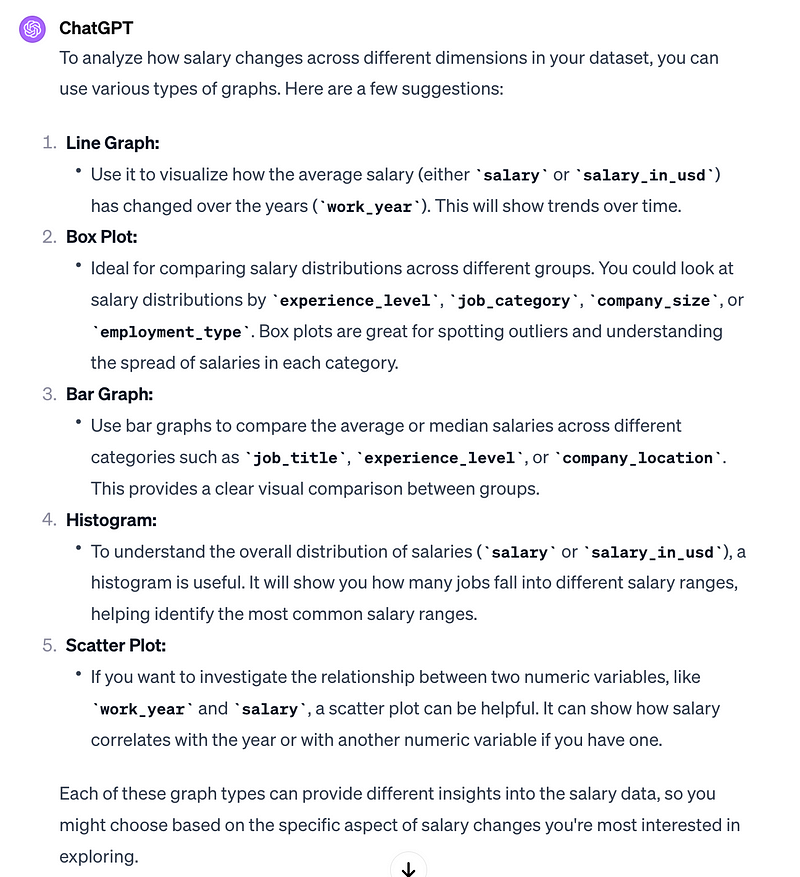
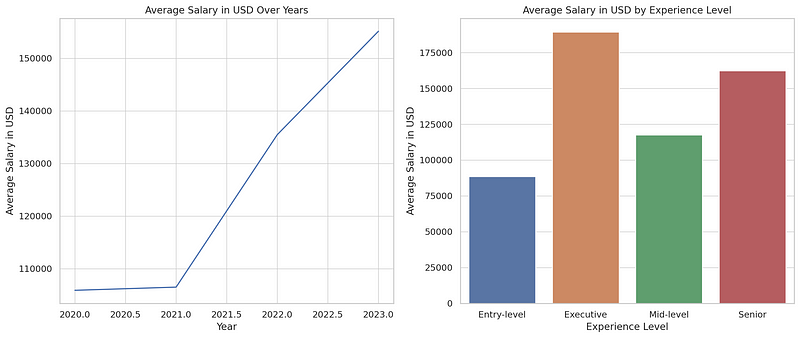
Great we are getting there. Now you can choose whichever you want from the menu above. I chose first one and third one, here is the output.
If you want to know more about, how to use ChatGPT to create graphs, you can read this one.
Machine Learning With ChatGPT
Now we are at the final stage. Here, let’s build a model to predict salary, by using other variables.
This step can enhanced of course, by using different techniques to increase your model’s efficiency.
Since we’ll use regression and Sci-kit learn as coding library, you can take reference from scikit learn official docs, here is our prompt.
Create three different regression models using scikit-learn in Python,
to predict salary. Include necessary techniques from the scikit-learn library to reduce the MAE.
At the end, save the results to the dataframe, results_df.
Then visualize the MAE for each regression model in a bar chart.
Here is the output.

In case you might miss what we did at this step ;
Here we built 6 different regression models, by using sci-kit learn, predict the salary. Compute the MAE for each model to evaluate their performance, then visualize the results by using bar chart.
All it took 64 lines of codes at 10 seconds.
Final Thoughts
Now some of you might be still thinking, that ChatGPT is not vital part of Data Science. I highly disagree with. Before ChatGPT, I don’t know any tool that write 64 lines of codes at 10 seconds.
However, you might know a little bit more then you think, to be a data scientist, because sometimes ChatGPT might output wrong code and you should be familiar with concepts to decode it.
If you enjoy what you saw and are curious about what comes next, you can subscribe to my updates on Substack. I share new GPT models developed by my team, AI news, exclusive articles, and projects, here.

These and Weekly AI pulse are available for my paid subscribers on substack.
Here are free resources of mine.
Here is the ChatGPT cheat sheet.
Here is my NumPy cheat sheet.
Here is the source code of the “How to be a Billionaire” data project.
Here is the source code of the “Classification Task with 6 Different Algorithms using Python” data project.
Here is the source code of the “Decision Tree in Energy Efficiency Analysis” data project.
Here is the source code of the “DataDrivenInvestor 2022 Articles Analysis” data project.
“Machine learning is the last invention that humanity will ever need to make.” Nick Bostrom


