
Doing and reporting your first mediation analysis in R
How to test for and report mediated effects
This tutorial will explain what a mediation analysis is, show how to simulate data for mediation analysis, run the necessary statistical procedures, and write it up for publication. The introduction will be concerned with establishing what a meditation exactly is. If you know what mediation is and just want to know how to do it in R, jump to the chapter “Step #1: The total effect”.
A mediation might sound challenging, but in reality, it’s simple. A mediated effect is also called an indirect effect. It occurs when the independent variable's effect on the dependent variable is — as the name says — mediated by another variable: A mediator.
Some important considerations when thinking about mediation are:
- A mediator must be endogenous: This means that the mediator cannot be the treatment nor the study conditions. The mediator itself must be dependent on the exogenous variables, which often are the treatment or the study conditions in experimental research.
- A mediator must reveal more insight into how the independent variable impacts the dependent variable: A mediator reveals something about the process.
So a mediation helps us find out how an independent variable influences a dependent variable. By running a mediation analysis, we are testing hypotheses about the process of how the independent variable impacts the dependent variable.
Coming up with a mediated effect
For this article, we will simulate the data. I believe simulating the data really helps to make it clear what is going on in the data we are analyzing. The data will be based on the classic “iris” dataset, which is included in base R. Let’s first load the data. Also, at the same time, set the sample seed, so that your random number generators' results will be the same as the ones here.
df=iris
set.seed(12334)
The iris dataset contains 5 variables and 150 observations. The 5 variables are the length and the width of the sepal, the length and the width of the petal, and the species of iris blooms.

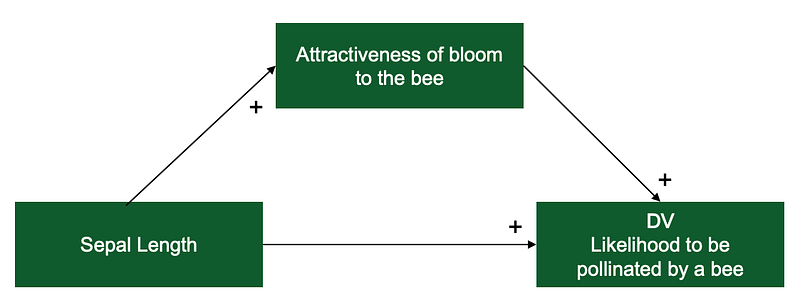
For this article, we will assume that the petal's length influences the likelihood of the bloom to be pollinated by a bee. However, this effect will not be a direct effect, but rather will be mediated by how attractive the bloom is to the bee. Therefore, our hypothesis would be that there is an indirect effect of the sepal length on the likelihood of the flower being pollinated by the bee via the bloom's attractiveness.
Only Sepal Length is a variable included in the iris dataset. The remaining two variables will be simulated. So for the next step, let’s simulate the data.
Simulating the data for the mediation
Simulating has a nice side effect that you can directly see what is going on in the data. This can improve your intuitive understanding of what the statistical results are telling you.
First, let’s simulate the mediator, “attractiveness to the bee.” This variable will be named mediator and — for our example — will consist of two parts. 35% of its value is Sepal.Length + 65% of its value is random noise. Imagine that the random noise in the variable “attractiveness to the bee” could be other bloom-specific attributes like color, shape, scent, etc.
df$random1=runif(nrow(df),min=min(df$Sepal.Length),max=max(df$Sepal.Length))df$mediator=df$Sepal.Length*0.35+df$random1*0.65Second, let’s simulate the dependent variable, “likelihood to be pollinated by a bee.” This variable will be named dv and consists of two parts again. 35% of its value is the Mediator, + 65% of its value is random noise. In our example, the random noise could be non-plant-specific attributes like the location of the flower, weather conditions, soil, etc.
df$random2=runif(nrow(df),min=min(df$mediator),max=max(df$mediator))df$dv=df$mediator*0.35+df$random2*0.65Now, around 12% (12.25% to be exact) of the information contained in “Sepal Length” should be included inthe dependent variable “likelihood to be pollinated by a bee” (as 35% × 35% = 12.25%). This is our expected total effect. The indirect effect via the mediator will be ‘stronger’ than the direct effect, as the dependent variable contains 35% of the information in the mediator “attractiveness of bloom to the bee.” This is exactly what mediation analysis shows.
How to provide support for the mediation with statistical procedures
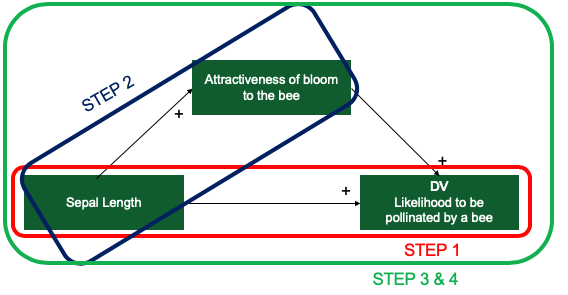
We will provide statistical support for the mediation with the help of the mediation analysis in four simple steps.
- First, we will test the total effect. Here we are looking if any change in sepal length impacts the DV at all. More on this later.
- Second, we will test the effect of the independent variable on the mediator. A significant effect of sepal length onto the mediator is an absolute prerequisite for mediation being possible.
- Third, we will simultaneously test the mediator's and the independent variable’s effect on the dependent variable. This is when the rubber hits the road and it all comes together.
- Fourth and lastly, we will estimate various quantities for causal mediation analysis, meaning that we will compare the direct to the indirect effect, giving us more insight into what is going on in the data.
Step #1: The total effect
The total effect describes the total effect that the independent variable (iv) sepal length has on the dependent variable (dv) likelihood to be pollinated by a bee. Basically, we want to understand whether there is a relationship between the two variables. There are two schools of thought on whether this relationship needs to be significant for a mediation to be able to occur:
- The first school of thought says that there must be a significant relationship between the two. Otherwise, even if there is a significant indirect effect, we cannot say for sure that changing the iv (in our case sepal length) has any impact on the dv (likelihood to be pollinated by a bee). However, this school of thought is slowly losing ground to the second school of thought.
- The second school of thought says that there doesn’t necessarily have to be a significant relationship between the iv and the dv. Just as correlation doesn’t prove causation, no correlation does not disprove causation (Bollen 1989, p. 52; Hayes 2018,p. 80). An argument that also makes sense.
In sum, you don’t need to have a significant total effect, but it definitively doesn’t harm to have one. When in doubt, talk to your co-authors, as I have made the experience that this is a highly individual decision. And hope that your eventual reviewers share your and your co-authors’ opinion.
Luckily, in our case, we will have a significant total effect as we simulated the data. So, we start by running a simple linear regression of the iv onto the dv plus any covariates you might have (none in our case).
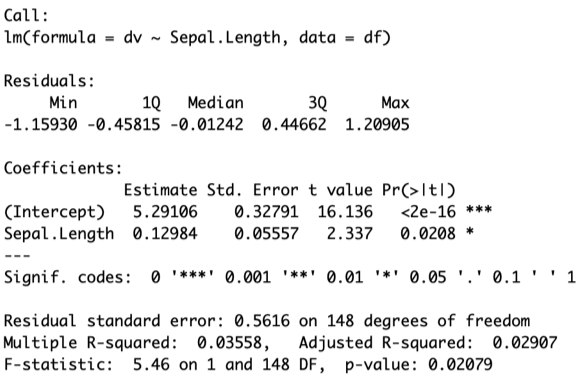
fit.totaleffect=lm(dv~Sepal.Length,df)
summary(fit.totaleffect)
This will yield the results below. As you can see, the total effect of sepal length on our dv is significant (p<.05), and the coefficient (.12984) is very close to the expected 12.25% (remember the 35% × 35% from above).
So now we have a significant total effect. Let’s proceed to step 2.
Step #2: The effect of the IV onto the mediator
To establish any mediation, the independent variable (iv, “sepal length” in our case) must significantly affect the mediator. This makes sense, as, for a mediation to take place, the iv must significantly impact the mediator.
So we do another simple linear regression of the iv onto the mediator plus any covariates you might have this time (none in our case).
fit.mediator=lm(mediator~Sepal.Length,df)
summary(fit.mediator)
This will yield the following results below. As you can see, the total effect of sepal length on our dv is significant (p<.05), and the coefficient (.30429) is close to the expected 35% from above.
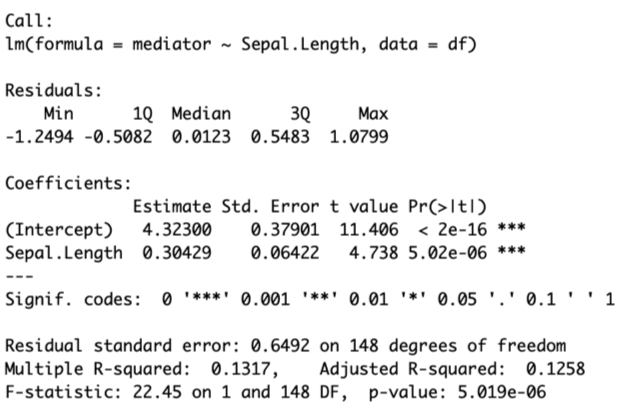
Now we have a significant effect of the independent variable “sepal length” onto the mediator “attractiveness of the bloom to the bee.”
Step #3: The effect of the mediator on the dependent variable
The third step confirms that the mediator affects the dependent variable while controlling for the independent variable. This means, that for a mediation to take place, the mediator must explain more or other parts of the variance in the dependent variable than the independent variable.
So, we do a simple linear regression of the independent variable and the mediator onto the dependent variable plus any covariates you might have this time (none in our case).
fit.dv=lm(dv~Sepal.Length+mediator,df)
summary(fit.dv)
This yields the following output:
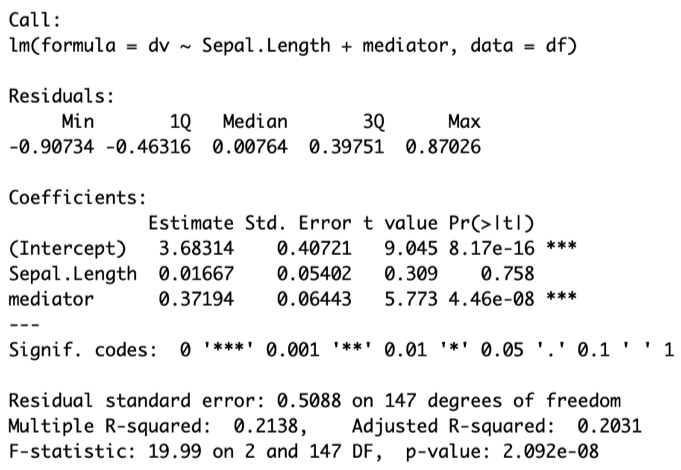
Note several things about this output:
- The mediator has a significant effect (p<.05) on the dv. With the result from step #2, we can now already say that there is a mediation. Again, the coefficient (.37194) is very close to the expected 35%.
- Whereas sepal length was a significant predictor of the dv “likelihood of pollination” before, it is no longer. In our data simulation, we included all the information of the IV that was contained in the DV also in the mediator, so this is not unexpected. In such cases, we speak of a “complete mediation.” This means that the total effect of the IV on the DV is explained by the mediator. In our case, it means that the total effect of “sepal length” onto “likelihood to be pollinated by a bee” goes through “attractiveness of the bloom to the bee.” Mediation analysis helps us understand the process of the effect of the iv onto the dv better. If the IV were still significant, we would speak of an “incomplete mediation,” which is also perfectly OK. An incomplete mediation implies another effect of the IV on the DV, which doesn’t go through the mediator.
Statistically, we have all the support we need to assume a mediation in the data. However, it is good practice to calculate the entire model in one. Mediation is a mini structural equation model (SEM), so if we wanted, we could use SEM-packages for R like “lavaan” to estimate the whole mediation. However, that would be quite complex. Thankfully, there are much easier ways to get the job done. That’s what step #4 is about.
Step #4: Causal Mediation Analysis
Let’s load up the necessary R packages.
#install.packages("mediation") #uncomment this command in case you haven't installed the mediation package yet.
library(mediation)
This loads (and installs) the Mediation package, which takes the regression models we just estimated, combines them and estimates the whole mediation. So let’s run the command.
results = mediate(fit.mediator, fit.dv, treat='Sepal.Length', mediator='mediator', boot=T)The mediate function from the mediation package asks for the models we just estimated and then requires us to specify the variable that is the treatment, i.e., our independent variable, and the variable that is the mediator. Also, we need to specify boot=T as, by default, mediate will use a quasi-Bayesian approximation for confidence intervals. However, we want to report percentile confidence intervals, so we set it to T for true. This command, which takes some time to run, will not produce any output yet. To get the output, we need to run the command below.
summary(results)This yields the following output:
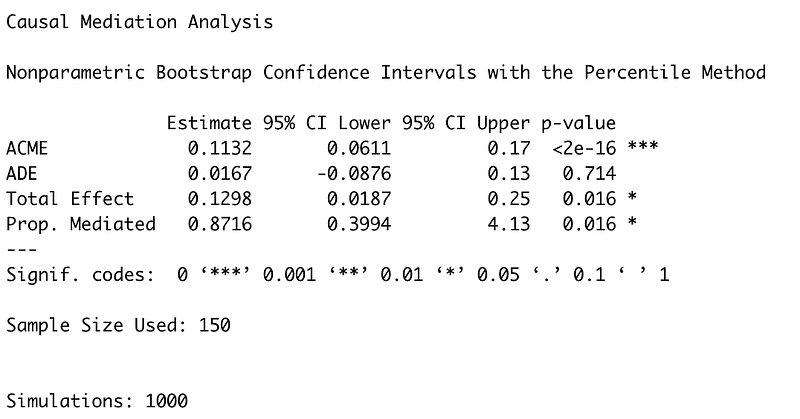
The acronyms can be somewhat intimidating, but here is what they mean:
- ACME stands for average causal mediation effects. This is the indirect effect of the IV (sepal length) on the DV (likelihood of pollination) that goes through the mediator (attractiveness to bee). Note that it estimated this effect to be .11 — this is exactly .30 (the effect of the IV on the mediator from step #2) times .37 (the mediator's effect on the DV from step #3) — so not necessarily new information. However, what is new, is that we now have a confidence interval and significance levels for the entire indirect effect, not only its two individual parts. This is something we need for reporting the mediation.
- ADE stands for average direct effects. It describes the direct effect of the IV on the DV. Again, this is not new information. We have calculated this effect in step #3: the direct effect of the IV on the DV when controlling for the mediator.
- Total Effect stands for the total effect (direct + indirect) of the IV onto the DV. This also isn’t new information. We calculated this in step #1. We can also get it by simply adding the ACME (.1132) and the ADE (.0167) to receive the total effect of .1298. We also already knew that the total effect was significant from step #1.
- Prop. Mediated describes the proportion of the effect of the IV on the DV that goes through the mediator. It’s calculated by dividing the ACME (.113) by the total effect (.13) to receive .87. This piece of information is a nice tidbit, but not necessarily the focus of our interest.
You see, we didn’t learn a lot of new things in this last step. However, we now have all the information we need to report the mediation.
Reporting the mediation
The mediation we calculated could be reported in the following way:
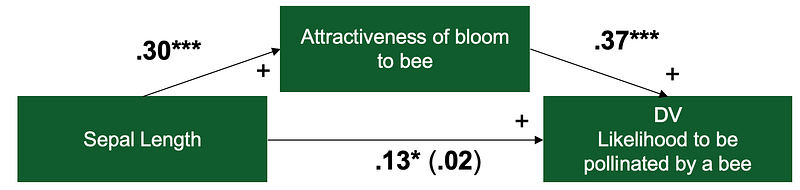
The effect of sepal length on likelihood of pollination was fully mediated via the attractiveness of the bloom. As Figure 1 illustrates, the regression coefficient between sepal length and likelihood to be pollinated and the regression coefficient between attractiveness and likelihood of pollination was significant. The indirect effect was (.30)*(.37) = .11. We tested the significance of this indirect effect using bootstrapping procedures. Unstandardized indirect effects were computed for each of 1’000 bootstrapped samples, and the 95% confidence interval was computed by determining the indirect effects at the 2.5th and 97.5th percentiles. The bootstrapped unstandardized indirect effect was .11, and the 95% confidence interval ranged from .06 to .17. Thus, the indirect effect was statistically significant (p<.001).
The coefficients for the figure were taken from the different models in steps #1 through #3. Most of the text's information was taken from the results of the mediate function (step #4). We ignored it before, but the mediate function does perform bootstrapping, i.e., it recalculates the model 1000 times with randomly drawn subsamples from the data. This is done to be more confident about our results.


