
Does the ‘I Won’t Give Up until I Have a Son’ Strategy Create Gender Imbalance?
A mathematical exploration of preference for sons in some culture
Background
I grew up in an Eastern culture where sons are preferred over daughters, particularly in the 70s and 80s in some disadvantaged areas where labour intensive works such as farming were relied upon to support a family. I’ve even heard stories about particular regions where women weren’t allowed to dine with men at the same table.
Whilst this unfortunate preference is dissipating in recent times, some households may still consider having at least one son when planning to have children. One strategy (“the Strategy”) may be to continue to give birth until a son is born.
Societal and ethical issues aside, assuming all households implement such strategy, an interesting question could be asked as to whether this creates more females (daughters) than males (sons) in the population, potentially leading to gender imbalance. Let’s hear what the maths says about this.
The Maths
The hypothesis that the Strategy creates more females than males may be tested using simple probabilities.
Table 1 below illustrates the possible scenarios under the Strategy.
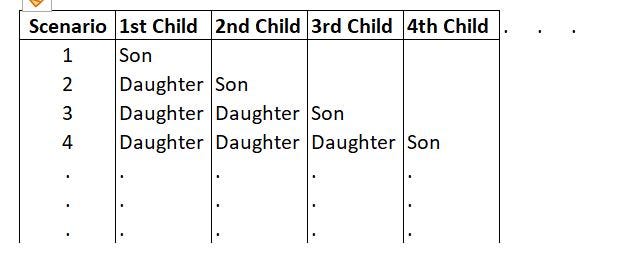
For instance, assuming it’s equally likely to have a son and a daughter, Scenario 1 has a probability of 1/2, Scenario 2 has a probability of 1/2 × 1/2, Scenario 3 has a probability of 1/2 × 1/2 × 1/2, and so on. To generalise, Scenario n has a probability of (1/2)ⁿ.
The expected number of sons is then given by the sum of probabilities of all scenarios. In particular:
The equation above is a geometric progression of closed form, which has a solution of 1. That is, the expected number of sons is 1 for a family adopting the Strategy.
What about the expected number of daughters?
Referring to Table 1, the expected number of daughters under Scenario 1 is 0 (or 1/2 × 0), the expected number of daughters under Scenario 2 is 1/2 × 1/2 × 1, the expected number of daughters under Scenario 3 is 1/2 × 1/2 × 1/2 × 2, and so on. To generalise the same, expected number of daughters under Scenario n + 1 is (1/2)ⁿ × n.
The expected number of daughters is then given by the sum of probabilities of all scenarios. In particular:
Although this is not a typical geometric progression, it’s not too hard to solve.
Let the sum of the equation above be S. If we write out S and S × 2 respectively:
Subtracting S from 2S gives a geometric progression (by subtracting terms of the same power). In fact, this geometric progression is identical to the equation that gives the expected number of sons above, which sums to 1.
Hence 2S-S = S = 1. That is, the expected number of daughters is 1, same as the expected number of sons, for a family adopting the Strategy.
The Conclusion
Is it surprising that the hypothesis that the Strategy creates more females than males doesn’t hold? Not mathematically.
First term under the ‘Son’ equation has a value of 1/2, which would take the ‘Daughter’ equation 3 terms to catch up (0 + 1/4 + 2/8). Although the ‘Daughter’ equation appears to sum to bigger value, they offer the same sum.
This implies that if a population has a gender imbalance, it’s caused by other factors. Some examples of these may be genetics or Government policies / incentives.
Question for readers — what happens to the numbers if the Strategy were to have at leasat one daughter?
Did you like to see maths tell you a story like what this artice did, you can sign up to Medium using the link here for more!