
Do Twitter Opinions Lead to Great Stock Returns?
Using Python to backtest a trading strategy based on tweet sentiment analysis

About a week ago, I wrote an article about Twitter’s connection to the stock market. At the conclusion of this article, I wondered what would happen if a stock trading strategy was based solely on the sentiment of Twitter users. Could the opinion of the crowd lead to profit? Is there money to be made if you just traded stocks based on what everyone else was tweeting?
We’ve seen it before with the rise of meme stocks like GameStop (GME) and AMC. So it wouldn’t be too crazy to assume that these type of stocks could follow the sentiment of users on social media such as Twitter. Twitter users can be very vocal for their support or disapproval of a specific stock. So why don’t we use that sentiment for a stock trading strategy and see what happens!
In order to test out this strategy, we’ll need to perform some backtests using Python and several libraries. We’ll use a technique called vectorized backtesting to observe the performance of our strategy. The details of the strategy will be explained later on. Feel free to code along or just keep reading if you want. Let’s go!
Some Needed Python Libraries
To begin, we’ll need to import a set of libraries for all the functions and code we’ll need to run:
import twint
import nest_asyncio
nest_asyncio.apply()
import pandas as pd
from nltk.sentiment.vader import SentimentIntensityAnalyzer
from datetime import datetime, timedelta
import plotly.express as px
import yfinance as yf
import numpy as np
import time
Functions Needed
For this next part, we’ll create a bunch of helper functions that can assist us in organizing our code better. Most of these functions were used before in my previous article but I’ll briefly describe them as they come up.
Getting Tweets
In this function, we are using the library called Twint and configuring it. This will allow us to retrieve a set amount of tweets on a given date.
Getting Tweets over a period of time
This retrieves tweets between two set dates. It runs recursively by using the twint function before and will return a Pandas DataFrame containing a collection of the tweets. Two quick notes about repetitively running the Twint query:
- Twint occasionally misses some tweets especially if the tweets are from a while ago.
- The sleep method is done to prevent from overdoing the search query too quickly because it can cause a temporary authentication error in the query.
Getting Sentiment
This uses the NLTK Vader sentiment analyzer which fits extremely well with Tweets. It basically analyzes a tweet and returns a compound score ranging from -1 to 1 that represents how positive or negative sounding a tweet is. This function returns a dataframe of the sentiment scores based on a given dataframe of tweets.
Getting Price Data
This function is similar to the same function in my previous article that retrieves closing prices from a given stock ticker but contains one key difference. Instead of the percentage returns each day, it contains the log returns of each day. Log returns are better suited for the backtesting we are about to do.
Another option to retrieve price data would be to use a financial data API such as EOD Historical Data. It is free to sign up and you’ll have access to vast amounts of financial data. Disclosure: I earn a small commission from any purchases made through the link above.
Getting Sentiment and Price
This function uses the previous functions together and combines them into one, consolidated dataframe. In this dataframe the sentiment scores are shifted ahead by one day to offset lookahead bias. The NaNs within the dataframe are filled with zeroes to accommodate our backtesting method.
Getting Trade Positions
This function represents our trading strategy. It determines when we buy, sell, or hold represented as 1, -1, and 0 respectively. For everyday, there is a set of tweets and the average sentiment score for that day. Our strategy is this:
- If that average score is greater than our set threshold, then we buy.
- If it is less than the negative of that threshold, then we sell.
- Otherwise, it is a hold.
We also have an option to allow or disallow shorting/selling. In case we only wanted to be bullish in this strategy.
Backtesting Function
This function finally performs the backtest for our strategy. It uses the previous functions to get the positions we need and returns the performance of the backtest. By multiplying the positions and the log returns, we are able to record the daily balance expected and see how our portfolio is holding up.
Performing the Vectorized Backtest
Now we finally get to utilize all the functions above to perform our backtest. First, we’ll need to decide on which stock to test it out on. Let’s stay within our meme stock theme and pick AMC:
# Time periods
now = datetime.now()
# How far back to retrieve tweets
ago = now - timedelta(days=10)# DF for sentiment and log returns
df = sentimentAndPrice(
"AMC",
now.strftime("%Y-%m-%d"),
ago.strftime("%Y-%m-%d"),
numtweets=20
)The code above uses the functions we already made to retrieve the price and daily, average sentiment scores from the last ten days. Then, we’ll run the backtesting function with one line of code:
performance = vectBacktest(df)Charting the Performance
We can see the raw the numbers of the performance if we want but it might be better to just visualize it. Let’s use Plotly to visualize our results:
px.line(performance,
        x=performance.index,
        y=performance,
        title='Portfolio Performance',
        labels={"y": "Portfolio Balance"})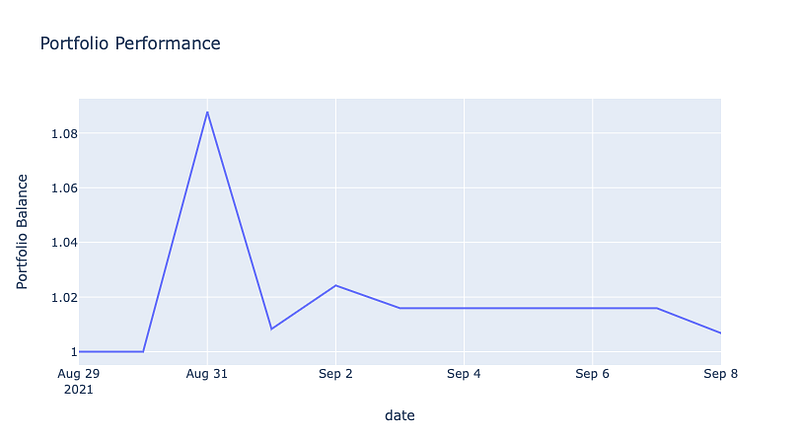
Based on our backtest, if we traded AMC by following Twitter users’ sentiment, then we would have ended up with a less than 1% gain in over the last ten days. The chart above does show a brief spike but it is quickly mitigated in the next few days.
But what about other stocks? What if we wanted to test out multiple stocks at once over a longer period of time? In the following section, we’ll see how to backtest multiple stocks.
Backtesting More Than One Stock
The stocks we will be testing will, again, be under the meme stock theme — AMC, GME, PLTR, and SPCE. In order to backtest these stocks, we’ll basically be using the same code as before but throwing it into a “For” loop:
# The list of chosen stocks
tickers = ["AMC", "GME", "PLTR", "SPCE"]
# Time periods
now = datetime.now()# How far back to retrieve tweets
ago = now - timedelta(days=60)# Individual stock df
stock_df = pd.DataFrame()# Iterating through each ticker
for ticker in tickers:
# DF for sentiment and log returns
sentiment = sentimentAndPrice(
ticker,
now.strftime("%Y-%m-%d"),
ago.strftime("%Y-%m-%d"),
numtweets=40
)
# Getting the backtest results for an individual stock
stock_perf = vectBacktest(sentiment) # Adding this performance to the stock's df
stock_df[ticker] = stock_perfFor these set of stocks, we’ll be looking back 2 months for tweets and price data. After the end of each loop, we attach the stock’s backtested performance into a new column within a dataframe representing our entire portfolio.
Note: running this function may take quite some time, even longer if you have the time frame looking further back than two months.
Visualizing the Results
Now that we have the performances for multiple stocks, we can visualize the results:
px.line(stock_df,
        x=stock_df.index,
        y=stock_df.columns,
        title='Portfolio Performance for each Stock',
        labels={"value": "Portfolio Balance",
                "variable": "Tickers"})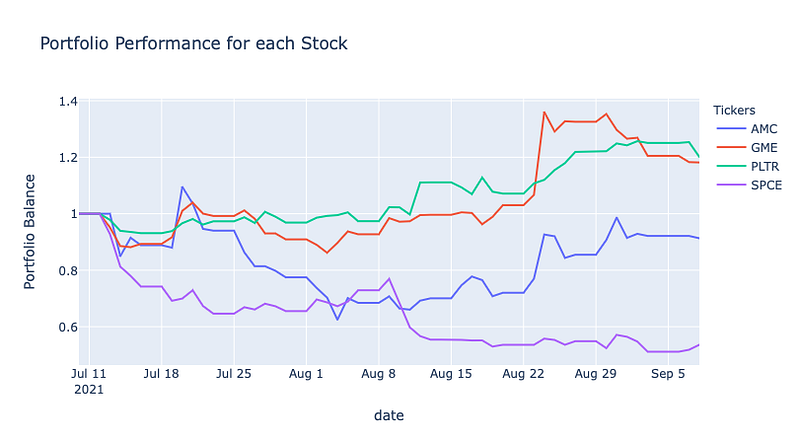
It appears that we really only have two stocks that perform well at the end of this backtest — GME and PLTR. The other two didn’t do so well.
But what does our overall portfolio look like if we combined the results?
# Getting the overall performance for all stocks
portfolio = stock_df.apply(lambda x: x/len(tickers)).sum(axis=1)
# Visualizing the overall portfolio
px.line(portfolio,
x=portfolio.index,
y=portfolio,
title='Overall Performance',
labels={"y": "Portfolio Balance"})Here we just divide the performance of each stock by the number of stocks we have. Then, we just sum up everything and visualize our entire portfolio:
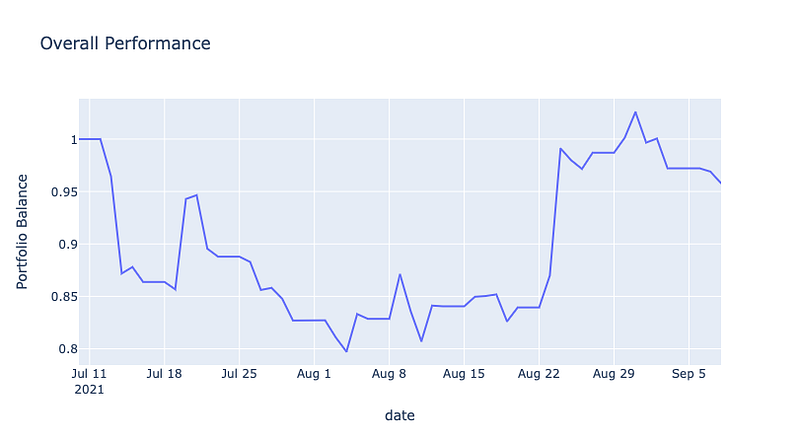
The chart here shows what would’ve happened if we allocated our funds equally across all four stocks. The results are less than ideal. The performance of GME and PLTR weren’t enough to compensate for the losing performances of AMC and SPCE.
Closing Thoughts
Tweet sentiment alone is most likely not enough to build a successful investment strategy. Social media sentiment can still be a great tool for informing your trading decisions but it should be considered in relation to other financial factors.
The code above only scratches the surface of this type of trading strategy. Feel free to adjust any other parameters to see if you get different results. Maybe choose other stocks unrelated to the meme stocks we picked. In the end, always be cautious with your trading strategies and make sure they align with your overall investment goals.