
Divide and Conquer — How to Deal With Complex Datasets
Real-life data is messy, complex, and hard to understand! Let’s see how we can make it a little simpler!
One of my favourite approaches to dealing with large, complex problems is to break them down into smaller, more manageable sub-problems. This makes it easier to focus on the important bits without being overwhelmed by the details. At Skil.AI, we often deal with enormous, complicated datasets which can seem quite daunting to tackle! As with most real-life datasets, our data is often messy, noisy, and generally the opposite of clean. In such cases, it can be helpful to break down the dataset into smaller chunks so that it can be analyzed and understood easily.
Sometimes, there may be obvious logical ways to split the dataset, but that’s not always the case. Fortunately, clustering algorithms can be used to automatically figure out good ways to split a dataset. A clustering algorithm groups a set of objects such that the objects in the same group are more similar to each other than to the objects in other groups. Best of all, we don’t need the datasets to be labelled in any way as clustering is an unsupervised task.
While clustering can be performed on any kind of data, we’ll be focusing on image clustering in this article. The clustering pipeline that we use can be split into 3 main steps — feature extraction, clustering, and analysis.
Feature Extraction
A clustering algorithm generally expects an input of the shape [n_samples, n_features]. In other words, the input is a list of the same length as the number of samples in the dataset, where each item in the list is the features for that particular sample.
A naive way to build this input would be to simply use the pixel values for the image as the features for the image. However, this is less than ideal as the raw pixel values usually contain a lot of noise. A better way to generate the features is to use the output vector from models pre-trained on image data, e.g. ResNet. The features generated from pre-trained models like ResNet are typically more robust to noise and capable of representing the important features of a given image.
We can build a feature extractor based on ResNet with Pytorch as shown below.
Clustering
Now that we have a way to generate the features for our clustering algorithm, the next step is to figure out the actual clustering algorithm to use. While there are many different clustering algorithms that could be used (see here), we’ll go with the popular K-Means algorithm.
First, we’ll build our inputs using the ResNet feature extractor.
Next, we’ll cluster the images based on their features. Note that, the K-Means algorithm requires specifying the number of clusters.
That’s it! The labels variable holds the list of labels (the cluster to which the image was assigned) for each image.
Analysis
So, we’ve done the clustering but how do we know if it’s any good? For starters, we can create a directory for each cluster and copy each image to the relevant directory.
While copying the images to their own cluster directory is useful for further analysis, we can also get a quick overview of the clusters by plotting the feature vectors and their associated labels.
However, we can’t plot the feature vectors directly as each feature vector contains 1000 discrete values, i.e. a feature vector is a 1000-dimensional vector. Since we can’t visualize 1000 dimensions, we can perform dimensionality reduction on the vectors to reduce them to 3 dimensions. Again, there are many different ways to do this, but we’ll be using t-SNE.
Now, df contains the features (in 3 dimensions) and the labels for all the images.
We’ll use Plotly to visualize the dataframe.
This will generate a plot as shown below.
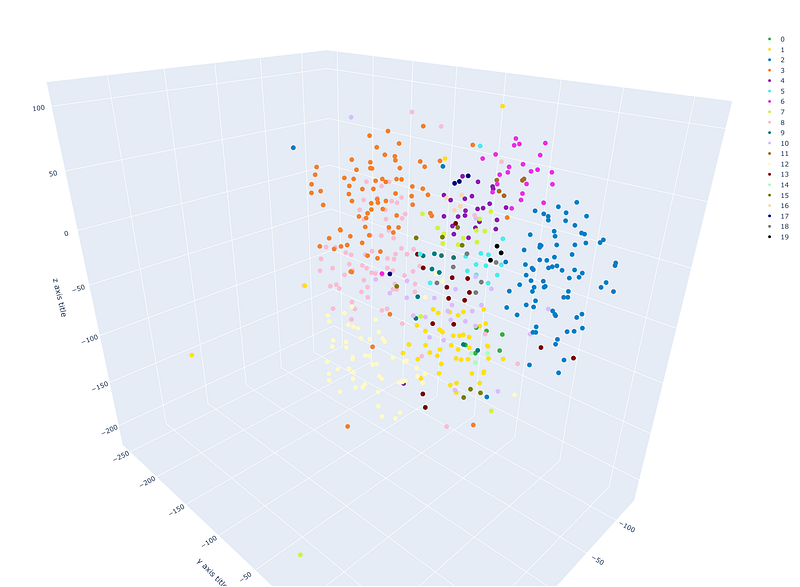
Generally speaking, the clusters (dots of the same colour) should be grouped together and relatively far away from the other clusters. The clusters may show better separation with a higher number of clusters, depending on the dataset.
That’s all! I hope this will be a useful tool in your toolbox for data analysis!
I am a consultant in Deep Learning and AI-related technology for Skil.ai. As part of the Deep Learning Research team at Skil.ai, we work towards making AI accessible to small businesses and big tech alike. This article is aimed towards sharing our knowledge.


