Spring Boot 3x App — Enable Distributed Tracing using Micrometer, OpenTelemetry And Jaeger
Preface
In distributed systems, knowing how a request traversed from one service to other to form the eventual response, gives us an edge in our System Observability and Issues debugging.
Spring Cloud Sleuth had played a vital role for a very long time in easily enabling Distributed Tracing with any Spring Boot applications with minimal effort. Now, with Spring 3.x and in the wake of unification of Observability (Logs, Traces & Metrics) along with decoupling / streamlining the development for each facilitating Tracing and Reporting Vendors (OpenTelemetry, Brave, Zipkin, Wavefront, Jaeger etc), it made sense for Spring community to defunct Spring Cloud Sleuth and just amalgamate all tracing efforts into Micrometer.
Like Sleuth, with Micrometer Tracing, we get a lot of out-of-the-box benefits, with little to no overhead to our systems tracing capability while maximizing the portability, including but not limited to:
- Seamless integration with Spring Boot
- Easy instrumentation of our app
- No vendor lock-in, switch vendors anytime, by merely changing dependencies & configuration.
This blog will give you a full overview of the minimal configuration required to enable any Spring Boot app with Distributed Tracing capability using the following toolsets:
- Micrometer — For code instrumentation & provide tracing bridge to OpenTelemetry
- OpenTelemetry — For tools to collect and send telemetry data to the reporter/collector
- Jaeger — For visualizing, monitoring & troubleshooting distributed systems micro-service traces.
For OpenTelemetry integration, we’ll focus on Boot 3 OpenTelemetryAutoconfiguration class, which auto-configures Distributed Tracing of our app, based on available dependencies in the classpath.

First, notice its Conditional reliance on the Micrometer OtelTracer class & other OpenTelemetry classes, so we will add the following micrometer dependencies:

NOTE: These are spring BOM managed dependencies, so
tag is not mentioned, unless you want to override to specific version. Check all the latest of versions managed by Spring BOM. https://docs.spring.io/spring-boot/docs/current/reference/html/dependency-versions.html
micrometer-tracing-bridge-otel — provides micrometer bridge/facade to Opentelemetry tracing. It also transitively brings all Opentelemetry dependency SDK toolsets for Span tracing, propagation & instrumentation.
opentelemetry-exporter-otlp — provides Span exporting/reporting toolset to any external OpenTelemetry protocol (OTLP) compliant collector.
Second, since OpenTelemetry, also known as OTel for short, is itself a vendor-neutral open-source Observability framework for instrumenting, generating, collecting, and exporting telemetry data (traces, metrics, logs), notice how OpenTelemetryAutoConfiguration, expects one or more beans definitions (in case any business use case expects collecting traces to multiple vendors) to support underlying Propagation format(s) TextMapPropagatorand use of Span exporter protocol(s) SpanExporter.

Since Jaeger v1.35, the Jaeger backend can receive trace data from the OpenTelemetry SDKs in their native OpenTelemetry Protocol (OTLP), however, the internal data representation & UI hasn’t changed. Thus,
- For Span propagation, though W3C propagation is enabled by default, we will have to enable the Uber propagation format for Jaeger.
- For Span export, we will enable OTLP/gRPC exporter.
Here is what our custom OtelConfiguration class will look like:
import io.opentelemetry.context.propagation.TextMapPropagator;
import io.opentelemetry.exporter.otlp.trace.OtlpGrpcSpanExporter;
import io.opentelemetry.extension.trace.propagation.JaegerPropagator;
import io.opentelemetry.sdk.trace.export.SpanExporter;
import org.springframework.context.annotation.Bean;
import org.springframework.context.annotation.Configuration;
@Configuration
public class OtelConfiguration {
@Bean
public TextMapPropagator jaegerPropagator() {
return JaegerPropagator.getInstance();
}
@Bean
//You only need to provide this bean, if you want to use grpc (port 4317)
//vs http (port 4318) channel for span export.
//Otherwise Spring's OtlpAutoConfiguration class by default configures
//OtlpHttpSpanExporter bean.
//https://github.com/spring-projects/spring-boot/blob/main/spring-boot-project/spring-boot-actuator-autoconfigure/src/main/java/org/springframework/boot/actuate/autoconfigure/tracing/otlp/OtlpAutoConfiguration.java
public OtlpGrpcSpanExporter otlpExporter() {
return OtlpGrpcSpanExporter.getDefault();
}
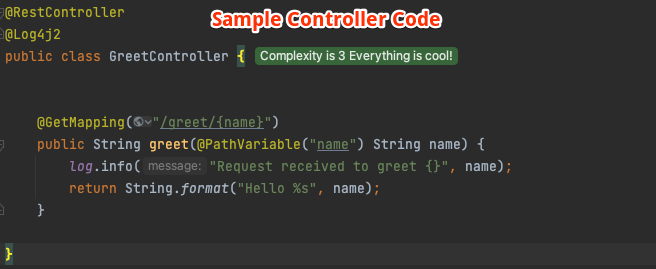
}Third, we will add traceId & spanId to our log configuration XML PatternLayout, enabling logging with traceId, to help track & debug issues.
[%MDC{traceId},%MDC{spanId}]
or (shorthand)
[%X{traceId},%X{spanId}]

Fourth, by default, spring sets the sampling rate to 0.1 (i.e. 10%), to reduce the data collected and reported out of the process. When a span is not sampled, it adds no overhead (a noop).
Note, Sampling is an up-front decision, meaning that the decision to report data is made at the first operation/service in a trace and that decision is propagated downstream to all the services.
If your app is first in the systems chain and you want all the incoming requests to be traced. Set the sampling rate to 1.0 in application.yml.

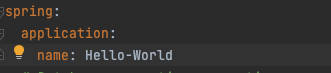
Fifth, Spring uses your application name as the service name for OTel reporting. See the below Bean configuration in OpenTelemetryAutoConfiguration class.

So, if not already set for any existing Cloud Config & Service Discovery, please set spring.application.name in your application.yml
Last, but not least, add the OpenTelemetry Noop bean to your @SpringBootTest config, so your Integration Tests will remain intact and won’t complain about No qualifying bean of type ‘io.opentelemetry.api.OpenTelemetry’ available

Voila, the moment of truth, now run the app, check your logs & jaeger dashboard (at http://localhost:16686) for traces:
Console Logs:

[2023-04-07T14:41:56,071] [INFO ] [http-nio-8080-exec-2] [215119191eabbb45ac47e8c57b607b08,364bc53eaf4c8816] c.a.o.GreetController.greet#14 - Request received to greet jaeger
[2023-04-07T14:42:43,809] [INFO ] [http-nio-8080-exec-3] [ccbd62e5c107d76a84b72e15aa2f29df,a0271532814566f3] c.a.o.GreetController.greet#14 - Request received to greet kumar
[2023-04-07T14:42:47,277] [INFO ] [http-nio-8080-exec-4] [1ea79f43324bcac3c5ffb6629950b653,6291a2cfa2f0da5f] c.a.o.GreetController.greet#14 - Request received to greet amith
NOTE: For the Jaeger collector to work with OpenTelemetry, the Jaeger version must be ≥ v1.35, and run with
COLLECTOR_OTLP_ENABLED=trueenvironment variable while exposing port 4317 (for OTLP/gRPC export). Optionally, port 4318 (for OTLP/HTTP export).
docker run -d --name jaeger \
    -e COLLECTOR_ZIPKIN_HOST_PORT=:9411 \
    -e COLLECTOR_OTLP_ENABLED=true \
    -p 6831:6831/udp \
    -p 6832:6832/udp \
    -p 5778:5778 \
    -p 16686:16686 \
    -p 4317:4317 \
    -p 4318:4318 \
    -p 14250:14250 \
    -p 14268:14268 \
    -p 14269:14269 \
    -p 9411:9411 \
    jaegertracing/all-in-one:latest
The implementation of this tutorial, adding Distributed Tracing using Micrometer, OpenTelemetry and Jaeger to your Spring Boot Web App, can be found in the GitHub project.
I hope you liked ❤️ this article. All feedback, comments & questions are welcomed 🙌. Stay tuned for more posts
Humble Request To Readers🙏
It takes time & effort to write these BLOGS. Please support me back by clicking on FOLLOW button (available at either the top right or bottom of the page). Your gracious support goes a long way for me.
Donation😇
If this helped you reduce the time to develop and you are feeling generous 🫶👐 today, then you can buy me a cup of coffee ☕