
Distributed Tracing in Microservices / Spring Boot
Hello everyone. In this article, let us read about distributed tracing in Microservices
What is Distributed Tracing?
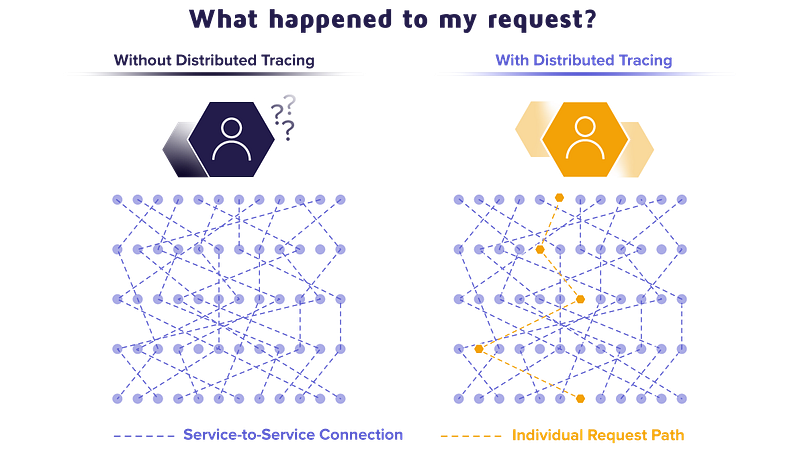
In a Microservices architecture, a request can travel across multiple microservices to build the response and send it to the user. If something goes wrong in some microservice, it is extremely difficult to pinpoint where it goes wrong. Here comes the application of Distributed Tracing.
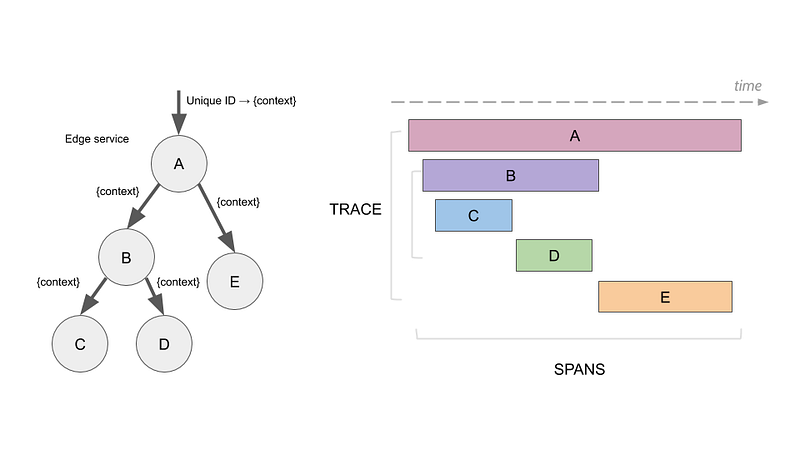
Distributed Tracing is the process of tracing every single request from the point of origin up to all the services it touches by analyzing the data. Every request will have a Trace ID, timestamp, and other useful metadata. With this, we can see how long the request spans across a particular microservice, and also we can get the metrics to improve the latency.
Benefits of Distributed Tracing
- End-to-End Visibility of the user request across the entire system of microservices
- Provides information about service dependencies
- Metrics and observability
- Resiliency when the system encounters a failure
Distributed Tracing vs Logging
There is always confusion between tracing and logging. Distributed tracing and logging can be used in an application to debug the issue and improve the areas where needed. But they are not the same.
Logging is the process of printing information or errors from an application to analyze what happened within that application whereas distributed tracing is the process of tracing a request from the first microservice until the last one it travels to find out where the failure has happened.
The idea is to start with logging in all the microservices and once the system grows complex, then tracing must be added across services. The metrics have to be monitored.
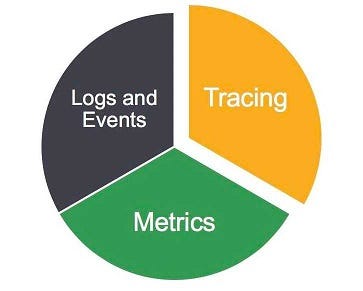
The three things Logging, Tracing, and Monitoring form the key pillars of the Observability of any system
Distributed Tracing in Spring Boot Application
Lets us see how we can implement a quick and simple distributed tracing inSpring Boot
1. Implement Tracing
This step is to generate the Trace id for the request and pass it to the calls to other services and print in the logs. Spring cloud sleuth is the dependency needed to implement the tracing in Spring boot.
The logs will be printed in the below format
[application-name,traceid,spanid,zipkin-export]Adding Sleuth dependency to implement tracing
<dependency>
   <groupId>org.springframework.cloud</groupId>
   <artifactId>spring-cloud-starter-sleuth</artifactId>
</dependency>
2. Enable Tracing
Now that we implemented tracing, we just need to enable it through the Zipkin tracing server. We can do this by adding the following dependency
<dependency>
   <groupId>org.springframework.cloud</groupId>
   <artifactId>spring-cloud-sleuth-zipkin</artifactId>
</dependency>
Add the URL for the Zipkin server
spring.zipkin.baseUrl = http://localhost:9411/zipkin/After adding this, all the sleuth logs will be loaded into the Zipkin server
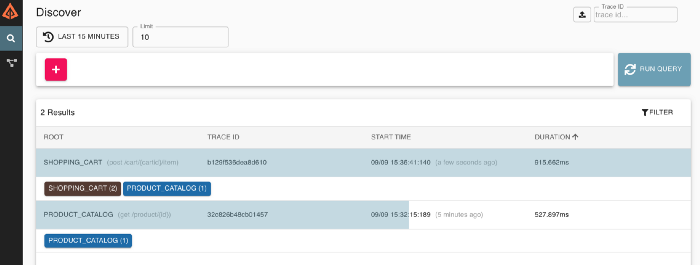
The above 2 steps should be followed for every microservice for which the teaching needs to be done and then we can see all those traces in Zipkin as follows using the URL
Types of Distributed Tracing Tools
The distributed tracing tools can be classified into 2 types as follows
- Code tracing tools
These tools are used to trace the line of code, variables declared, output, etc, and will help in code analysis and diagnostics. Examples of such tools are OpenTracing, OpenZipkin, Appdash, etc.
2. Data Tracing tools
These tools will trace by validating the critical data elements and monitoring them with process control. Some examples of Data Tracing tools are Datadog, Jaeger, New Relic, and Dynatrace. Most organizations use one of these tools as they provide a lot of insights into the metrics
There are a lot of tools available in the market and the tools should be selected based on the needs of the team. The main aim of these tools should be to focus on the Golden Signals of monitoring namely latency, traffic, errors, and saturation. Then based on the RED (Response, Error, and Duration) metrics, we can set up alerts to notify the team when something goes wrong or some metric level is breached
Thanks for reading this article. Stay tuned and happy learning!!!
If you like to get more updates from me, please follow me on Medium and subscribe to email alert.If you are considering to buy a medium membership, please buy through my referral link https://dineshchandgr.medium.com/membershiPlease go through my articles if you are interested


