

Distributed Tracing For Spring Boot 3x App Using Micrometer, Brave And Zipkin
Please check preface of my another blog for initial insight on Micrometer Tracing and it’s succession of Spring Cloud Sleuth:
Spring Boot 3x App — Enable Distributed Tracing using Micrometer, OpenTelemetry And Jaeger
This blog will give you a full overview of the minimal configuration required to enable any Spring Boot app with Distributed Tracing capability using the following toolsets:
- Micrometer — For code instrumentation & provide tracing bridge to OpenZipkin Brave.
- Brave — Distributed tracing Instrumentation library supporting both W3C & B3 trace context and propagation formats.
- Zipkin — For visualizing, monitoring & troubleshooting distributed systems micro-service traces.
First, we will understand the dependencies required for spring boot auto configuration to take place.
NOTE: For Gradle/Maven dependencies, since we are using all spring BOM managed dependencies, so
tag is not used, unless you want to override to specific version. Check all the latest of versions managed by Spring BOM. https://docs.spring.io/spring-boot/docs/current/reference/html/dependency-versions.html
For Brave integration, we’ll look at Boot 3 BraveAutoconfiguration and ZipkinConfigurations.BraveConfiguration classes, which auto-configures Distributed Tracing of our app, based on available dependencies in the classpath.


Notice their conditional reliance on the Micrometer BraveTracer class & other Zipkin classes including ZipkinSpanHandler, so we will add the following dependencies.
#build.gradle
implementation 'io.micrometer:micrometer-tracing-bridge-brave'
implementation 'io.zipkin.reporter2:zipkin-reporter-brave'micrometer-tracing-bridge-brave — provides micrometer bridge/facade to Brave tracing. It also transitively brings all Brave dependencies for instrumentation, Span tracing and context propagation.
zipkin-reporter-brave — provides capability of Span exporting/reporting to Zipkin.
Second, we will add traceId & spanId to our log configuration XML PatternLayout, enabling logging with traceId, to help track & debug issues.
[%MDC{traceId},%MDC{spanId}]
or (shorthand)
[%X{traceId},%X{spanId}]

Third, by default, spring sets the sampling rate to 0.1 (i.e. 10%), to reduce the data collected and reported out of the process. When a span is not sampled, it adds no overhead (a noop).
Note, Sampling is an up-front decision, meaning that the decision to report data is made at the first operation/service in a trace and that decision is propagated downstream to all the services.
If your app is first in the systems chain and you want all the incoming requests to be traced. Set the sampling rate to 1.0 in application.yml.

Fourth, Spring uses your application name as the local service name when reporting spans to Zipkin. See the below Tracing Bean configuration in BraveAutoConfiguration class.

So, if not already set for any existing Cloud Config & Service Discovery, please set spring.application.name in your application.yml
#application.yml
spring.application.name: springboot-micrometer-brave-zipkin
Voila, the moment of truth, now run the app with a local Zipkin server instance (docker run -d -p 9411:9411 openzipkin/zipkin), check your logs & Zipkin dashboard (at http://localhost:9411) for traces:
Console Logs:
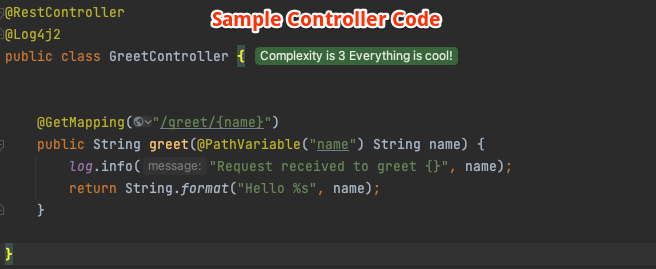
[2023-04-07T14:41:56,071] [INFO ] [http-nio-8080-exec-2] [215119191eabbb45ac47e8c57b607b08,364bc53eaf4c8816] c.a.o.GreetController.greet#14 - Request received to greet zipkin
[2023-04-07T14:42:43,809] [INFO ] [http-nio-8080-exec-3] [ccbd62e5c107d76a84b72e15aa2f29df,a0271532814566f3] c.a.o.GreetController.greet#14 - Request received to greet kumar
[2023-04-07T14:42:47,277] [INFO ] [http-nio-8080-exec-4] [1ea79f43324bcac3c5ffb6629950b653,6291a2cfa2f0da5f] c.a.o.GreetController.greet#14 - Request received to greet amith
NOTES:
1# Zipkin reporting URL which defaults to management.zipkin.tracing.endpoint in your application.yml .
2# W3C is the default propagation format, it can be switch to B3 by setting management.tracing.propagation.type: b3 in your application.yml .
The implementation of this tutorial, adding Distributed Tracing using Micrometer, Brave and Zipkin to your Spring Boot Web App, can be found in the Github project.
I hope you liked ❤️ this article. All feedback, comments & questions are welcomed 🙌. Stay tuned for more posts
Humble Request To Readers🙏
It takes time & effort to write these BLOGS. Please support me back by clicking on FOLLOW button (available at either the top right or bottom of the page). Your gracious support goes a long way for me.
Donation😇
If this helped you reduce the time to develop and you are feeling generous 🫶👐 today, then you can buy me a cup of coffee ☕


