
Discrete-Time Markov Chains — Identifying Winning Customer Journeys in a Cashback Campaign
Modeling customer interactions in a digital campaign as discrete-time Markov Chains — Part 2/2

Part 1: Trim the target audience in a Credit Card renewal campaign Part 2: Identify optimal customer journeys in a Credit Card cashback campaign
Measurement and attribution are a widely discussed topic within the data science community. And just as we were making scientific progress in the practice, there were disruptions from policies that threatened to discontinue cookies and tracking. In recent times, a forgotten modeling technique called Marketing Mix Modeling (MMM) has regained traction. It works across all digital and offline channels with reasonable accuracy. However, when it comes to digital-only campaigns where cookies aren’t used, there is a superior technique you can apply. We will discuss that in this article in great detail.
Understanding and optimizing customer touchpoints can help data scientists make recommendations that would increase loyalty, retention, and revenue.
Understanding the Problem
In this Medium article, we helped the fintech company Flex refine its target audience for the renewal campaign. Now, let’s assist them with their cashback campaign. Flex rewards its credit card holders for shopping at grocery stores, gas stations, restaurants, and streaming subscriptions. The rewards come as cashback of up to 5% straight into the wallet and can be applied towards the next bill payment. However, to be eligible for this, customers must activate the offer in the app once every quarter.
The campaign covers only digital channels like email, SMS and app notifications and aims to increase the activation rate for cashbacks. Are these offers profitable for Flex? The answer is Yes. They incentivize customers to spend at eligible merchants and these merchants, in turn, pay a small margin to Flex.
We are tasked with measuring the effectiveness of each digital channel: 1. How much did each channel contribute to activations? 2. What is the activation rate of each channel? 3. Which channel was the stickiest? 4. Did the channel activation rate vary by type of shopping? 5. Which channel reduced the length of customer journeys to activation?
These insights will help Flex re-evaluate its campaign strategies every other week. I am going to use Markov chains to model customer interactions, but first, let’s take some time to check out the creatives.
A peek into the advertiser’s creatives
As data scientists, it always helps to know what’s happening behind the scenes. How do marketers really reach out to the customer?
I would say Email and SMS are both effective channels for advertisers to reach their target audiences.
Email allows advertisers to send personalized messages with rich media and detailed information.
Dear X,
We are excited to announce a special offer for you! For a limited time, you can earn up to 5% cashback on your purchases at grocery stores, gas stations and restaurants with your Flex credit card. This is a great opportunity to save money on your everyday expenses and enjoy more rewards for your loyalty.
To take advantage of this offer, simply visit the cashback section in our app and hit the activate button. You will automatically receive the cashback as a statement credit on your next billing cycle. There is no limit to how much you can earn, so don’t miss this chance to make the most of your card.
If you have any questions or need assistance, please contact our customer service team at 1–800–123–4567 or visit our website. We appreciate your business and look forward to serving you better.
Sincerely, Team Flex
SMS
SMS offers a quick and direct way to communicate urgent offers and reminders.
Save more on your everyday spending with our credit card. Get up to 5% cashback on grocery, gas and restaurants. Apply now and enjoy this limited-time offer.
App Notification
There are also App Notifications which tend to be very sticky (tap and view). However, a large number of people have them disabled or may not have the app installed.
Don’t miss out on this amazing cashback offer! For a limited time, you can earn up to 5% cashback on eligible purchases with your credit card. Hurry, this offer ends soon. Tap here to learn more and activate your offer today.
Absorbing Discrete-time Markov Chains — that’s quite a mouthful
There are essentially three words to understand — Absorbing, Discrete-time and Markov Chain.
A Markov chain is a mathematical model that describes a sequence of states where the probability of each state depends only on the previous state. It is called an Absorbing Markov Chain when there is at least one state that, once entered, cannot be left. This state is called an absorbing state. The probability of reaching an absorbing state in a finite number of steps is always one. The discrete-time label refers to having a finite or countable number of states, and the transition from one state to another depends only on the current state and not on the previous history.
In Flex’s digital campaign, customers interact with the product through ad impressions or clicks. Every interaction is represented as a transitionary state — Email, SMS, App Notification and Retargeting. I will also add a Start state and two absorbing states — Activation and Null (no activation). We have access to the campaign data, and I can use it to calculate the probabilities of customers transitioning between states.
Let’s get started!
Campaign Logs — the goldmine of information
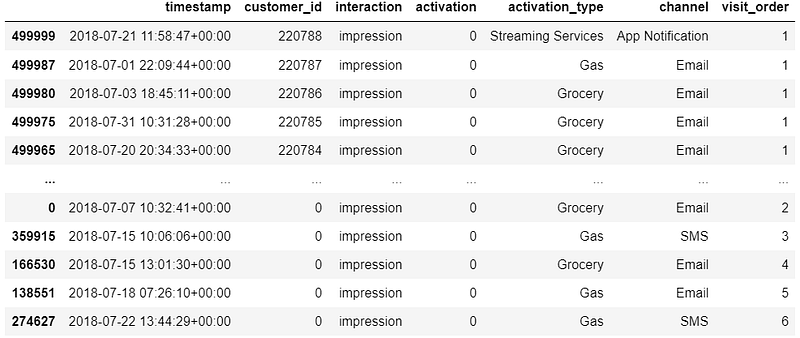
I have created a dataset that resembles what you would typically see in campaign logs. Since this is a contractual setting (customers operate their credit cards for many years), we have customer IDs for identity resolution. Every record is either an impression or an activation event originating from one of the 4 digital channels.
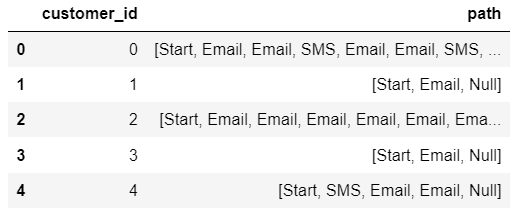
From Raw Data to Journeys
I will transform the data from long to wide format by creating journeys. One of the assumptions here is that a customer activates only once in the campaign. This works because once activated, the cashback applies for 3 months, far longer than the campaign.
If you remember the definitions, this makes Activation an absorbing state — that is once activated, the customer stays activated. In the coming sections, you will see how we can use properties of absorbing Markov Chains to simplify a lot of the linear algebra.
The overall activation rate of the campaign was ~7%.
Constructing the Markov Chain
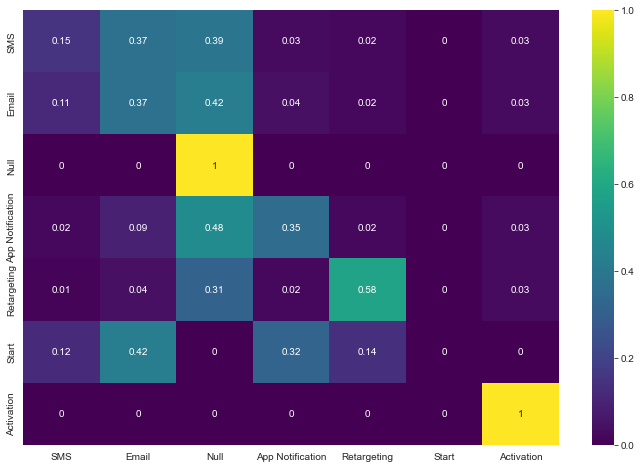
Constructing the chain essentially means calculating the transition matrix. What’s that? It is a square matrix that describes the probabilities of moving from one state to another in a stochastic system. The rows of the matrix represent the current state and the columns represent the next state. The sum of each row must be equal to one, since the probabilities of all possible transitions from a given state must add up to one.
Let’s visualize the Markov Chain we just created to better understand it. One way to visualize a Markov chain is to use a state diagram, which is a directed graph that shows the transitions between the states. The Nodes are states, and the edges represent transitions. The transparency of the edges represents the magnitude of probability of the transition.
I have used this Github repo created by Naysan Saran for this with little tweaks.
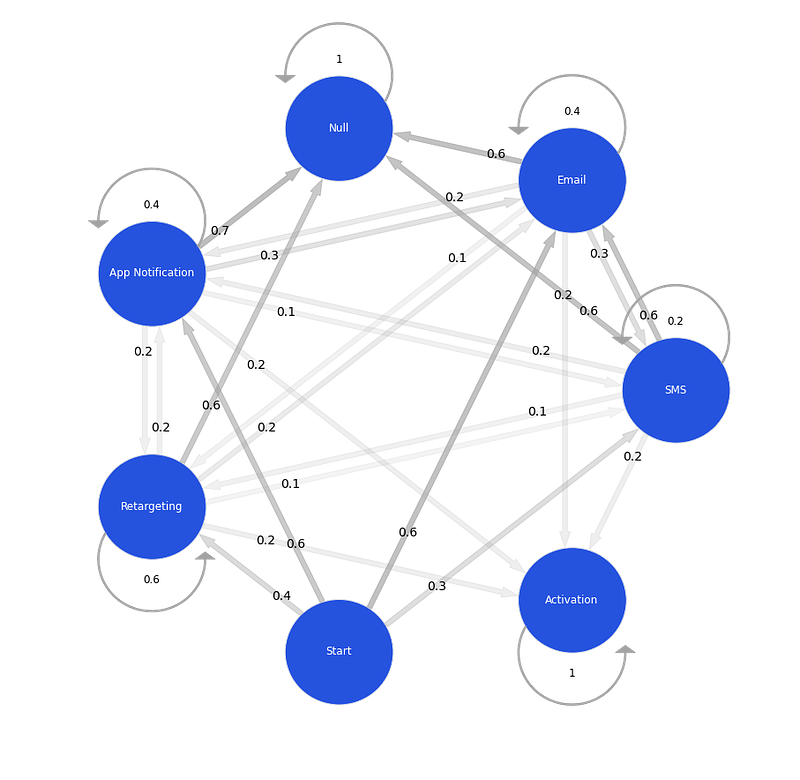
Many states have self-loops which mean they can stay within the state with a certain probability. What we need to note here is that for Null and Activation states, this probability is 1. This means that these are absorbing states. You can also see that they don’t have outward transitions.
Another observation is that Email has darker edges in and out, and you could say it is a frequently visited state.
Retargeting also has a relatively dark self-loop and that is probably because it’s most effective to retarget customers who have activated or shown intent in the past campaigns.
Removal Effects — Contribution towards activations
Removal effects are a type of sensitivity analysis in Markov models. They measure how much the model output changes when a certain state or transition is removed from the model. Removal effects can help identify the most influential or critical components of the model.
In an absorbing Markov Chain, removal effects measure the changes in the expected number of steps or the probability of absorption that occur when one or more transient states are removed from the chain.
Assume we have t transient states and r absorbing states in the markov chain. Let’s understand 3 important matrices.
Q: A t-by-t matrix where the (i, j) entry gives the probability of transitioning from transient state i to transient state j.
R: A r-by-t matrix where the (i, j) entry gives the probability of transitioning from transient state i to absorbing state j.
Iᵣ: A r-by-r identity matrix.
Expected number of visits to a transient state A basic property about an absorbing Markov chain is the expected number of visits to a transient state j starting from a transient state i (before being absorbed). This can be established to be given by the (i, j) entry of so-called fundamental matrix N, obtained by summing Qᵏ for all k (from 0 to ∞). Source — Absorbing Markov chain — Wikipedia
As Carl Neumann stated in his work, N matrix can be calculated as:

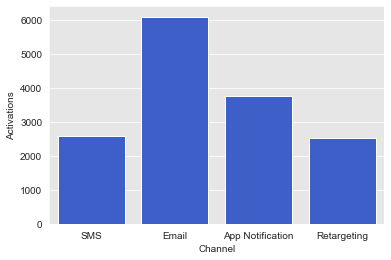
Through basic probability theory, the absorbing probability is calculated with the product of N and R. Since Activation is an absorbing state, we can get these probabilities from starting from each of the transient states or channels. We wouldn’t be using absorbing probabilities for the Null state in this analysis, but it could potentially help you find channels which make customers cut off.
We immediately see that Email influenced the most activations followed by App Notification.
For attributing an activation to a channel, I have considered the whole customer journey. We would be able to appreciate this more if we compare it to last-touch and first-touch methods of attribution. SMS and Retargeting are similar in effectiveness.
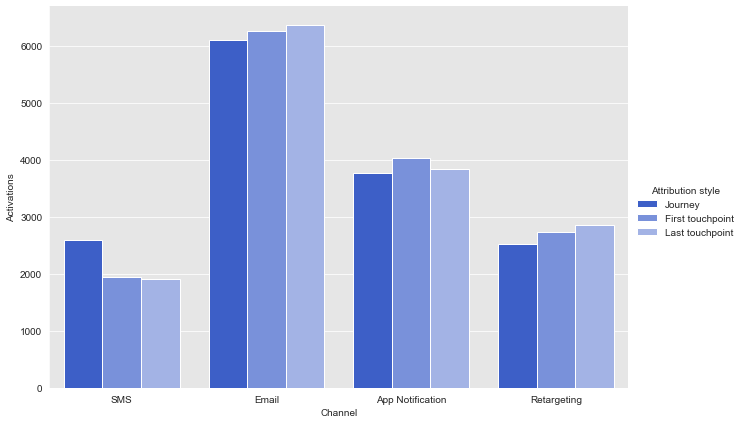
The first difference I see is that first-touch and last-touch fail to attribute enough to SMS. Last-touch over-estimates sticky channels which are closest to conversion such as App Notification where a customer just has to tap. Having all three in comparison helps in make more informed decisions.
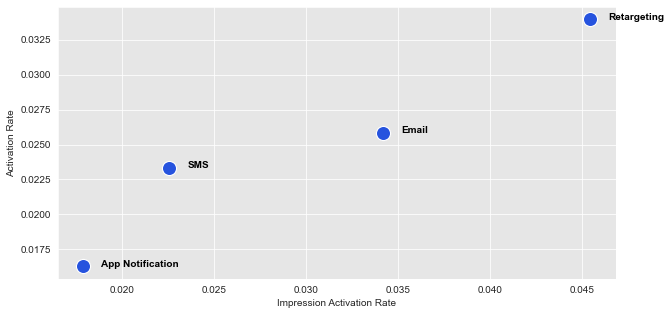
Activation Rate and Stickiness — How clickable are the channels?
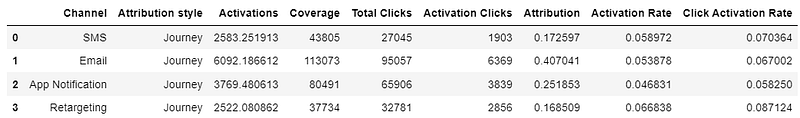
We instantly see, Retargeting has the highest activation rate of 6.6% although Email has the highest contribution (activations). In other words, if Retargeting covered 100 journeys, 6.6 of them resulted in activation. It makes sense because only customers who have applied for cashback offer before would be retargeted. They already have the intent.
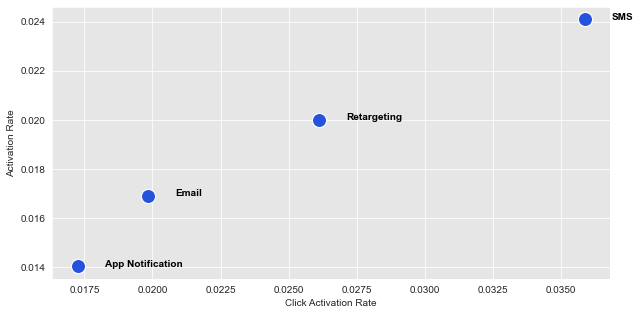
Another metric is the Click Activation Rate. The last impression in a journey is most likely to be a click and we can measure how many of those clicks resulted in activation for each channel.
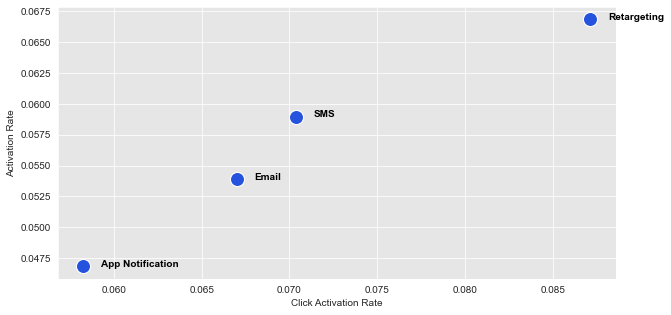
Although Email had the highest contribution in the campaign overall, it had a lower Click Activation Rate. Retargeting and SMS were the leaders.
Channel behaviors might be different when split by shopping category. For example, Email is more effective in Grocery.
Gas is a surprise. SMS is the most effective channel by a large margin.
Reducing Journey Lengths — Can some channels lead to activation faster than others?
Using another simple property of absorbing Markov chains, we can calculate the expected number of steps to activation once the customer lands at a channel.
Expected number of steps before being absorbed The expected number of steps before being absorbed in any absorbing state, when starting in transient state i can be computed via a sum over transient states. The value is given by the iᵗʰ entry of the vector T. Source — Absorbing Markov chain — Wikipedia
T is the row-wise sum of the N matrix.
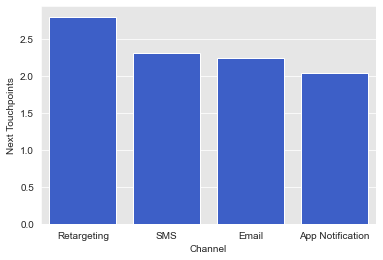
From this, we can tell that Retargeting and SMS are closest to activation.
Recommending a Strategy
We’ve answered the questions we started with but sometimes we have to make a recommendation to business partners — they can be the marketing team or senior execs. Let’s try!
App Notifications have their place in the campaign, but its coverage can be reduced. It isn’t sticky and is farthest from activation. I would also recommend increasing the coverage of SMS as it is very close to activation and can really pull car-owners who spend regularly on Gas.
Conclusion
I hope you learned how to use Markov chains to model customer interactions in a digital campaign for cashback offers. This is the simplest process for identifying the optimal customer journey that maximizes activation rate. However, in practice you would often add more granularity to the solution — may be split by shopping category or geography — to capture localized customer behaviors. If you have tried this or have any ideas, feel free to share in the comments.
Thank you for reading my post 🫶
What to read next? Try these
Uplift Modeling — A Data Scientist’s Guide to Optimizing a Credit Card Renewal Campaign
Marketing Mix Modeling: The Art of Measuring Marketing Effectiveness


