
Digital Image Processing using Fourier Transform in Python
Digital images are now part of our daily life. People can hardly live without it. Therefore, digital image processing becomes more and more important these days. How to increase the resolution of images or reduce noises of images are always hot topics. Fourier Transformation can help us out. We can utilize Fourier Transformation to transform our image information - gray scaled pixels into frequencies and do further process.
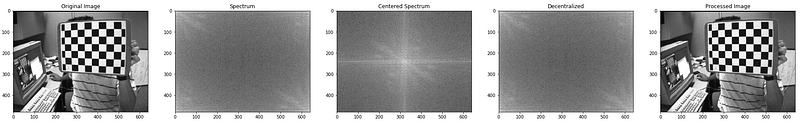
Today, I’ll talk about how to utilize Fast Fourier Transformation in digital image processing, and how to implement it in Python. The process flow is as following (from left to right):

- Implement Fast Fourier Transformation to transform gray scaled image into frequency
- Visualize and Centralize zero-frequency component
- Apply low/high pass filter to filter frequencies
- Decentralize
- Implement inverse Fast Fourier Transformation to generate image data
Let’s dive into each section to figure out the theory behind theses steps.
Fast Fourier Transformation
Digital images, unlike light wave and sound wave in real life, are discrete because pixels are not continuous. That means we should implement Discrete Fourier Transformation (DFT) instead of Fourier Transformation. However, DFT process is often too slow to be practical. That is the reason why I chose Fast Fourier Transformation (FFT) to do the digital image processing.
Step 1: Compute the 2-dimensional Fast Fourier Transform.
The result from FFT process is a complex number array which is very difficult to visualize directly. Therefore, we have to transform it into 2-dimension space. Here are two ways that we can visualize this FFT result: 1. Spectrum 2. Phase angle.
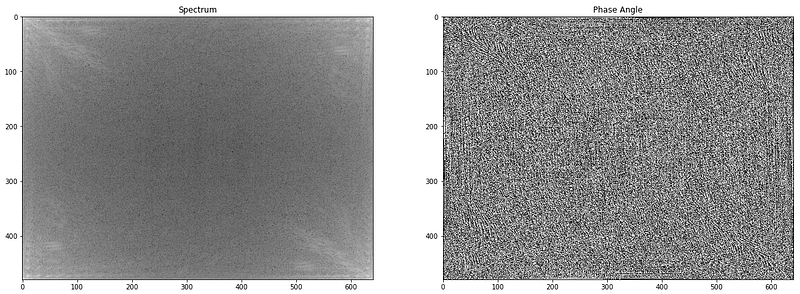
From Figure (d)(1), there are some symmetric patterns on the four corners. These patterns can be translated to the center of the image in the next step.
The white area in the spectrum image show the high power of frequency. The corners in the spectrum image represent low frequencies. Therefore, combining two points above, the white area on the corner indicates that there is high energy in low/zero frequencies which is a very normal situation for most images.
On the other side, it is hard to identify any noticeable patterns from Figure (d)(2). This did not indicate that the phase angle of FFT is totally useless because the phase preserves the shape characteristics which is an indispensable information for an image.
Step 2: Shift the zero-frequency component to the center of the spectrum.
2-D FFT has translation and rotation properties, so we can shift frequency without losing any piece of information. I shifted the zero-frequency component to the center of the spectrum which makes the spectrum image more visible for human. Moreover, this translation could help us implement high/low-pass filter easily.
Step 3: Inverse of Step 2. Shift the zero-frequency component back to original location
Step 4: Inverse of Step 1. Compute the 2-dimensional inverse Fast Fourier Transform.
The processes of step 3 and step 4 are converting the information from spectrum back to gray scale image. It could be done by applying inverse shifting and inverse FFT operation.
Code
In Python, we could utilize Numpy - numpy.fft to implement FFT operation easily.
After understanding the basic theory behind Fourier Transformation, it is time to figure out how to manipulate spectrum output to process images. First, we need to understand the low/high pass filter.
Low Pass Filter
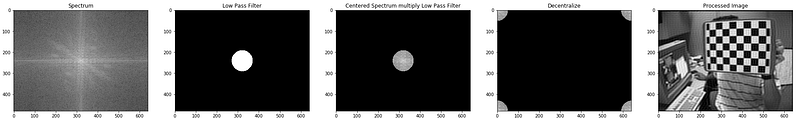
Low pass filter is a filter that only allow low frequencies to pass through. Low frequencies in images mean pixel values that are changing slowly. For example, smooth area with slightly color changing in the image such as the center of new blank white paper is considered as a low frequency content.
Since the output of low pass filter only allow low frequencies to pass through, the high frequencies contents such as noises are blocked which make processed image has less noisy pixels. Therefore, low pass filter is highly used to remove the noises in images.
High Pass Filter
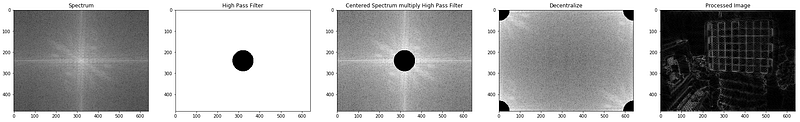
High Pass filter, on the contrary, is a filter that only allow high frequencies to pass through. High frequencies in images mean pixel values that are changing dramatically. For example, Edge areas in the image with huge color changing such as the edge between two overlap white and black paper is consider as the high frequency content.
The output from high pass filter captures the edges in image which could be used to sharpen the original image with proper overlap calculation. This will enhance sharpness in original image making edges more clear.
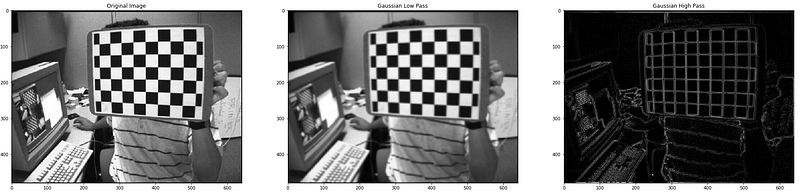
From Figure(e)(5) and Figure(f)(5), we could notice that these two filters present different characteristics. Low pass filter tends to preserve overall information in an image. On the other hand, high pass filter is trying to identify changes in an image.
After realized how the low/high pass filter works in previous section, let’s move on to get the right shape of filter.
Ideal Filter
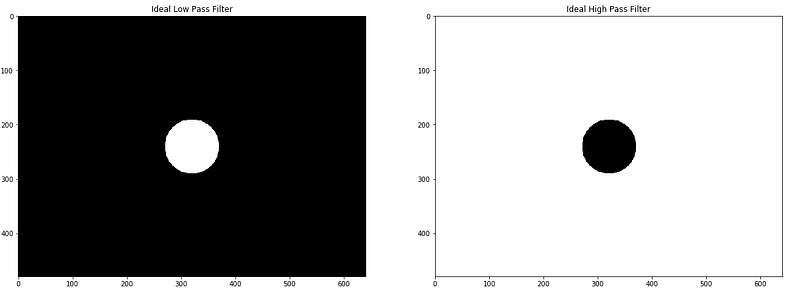
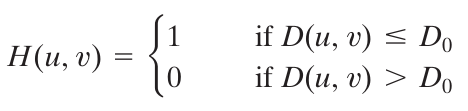
The idea which behinds ideal filter is very simple: Given a radius value D₀ as a threshold, low pass filter Figure (g)(1) has H(u, v) equals to 1 under the threshold, and H(u, v) equals to 0 when above the threshold.
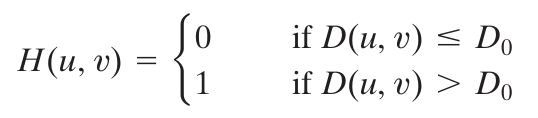
On the contrary, high pass filter Figure (g)(2) has H(u, v) equals to 0 under threshold, and H(u, v) equals to 1 when above the threshold.
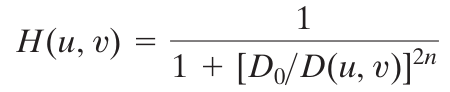
Butterworth Filter
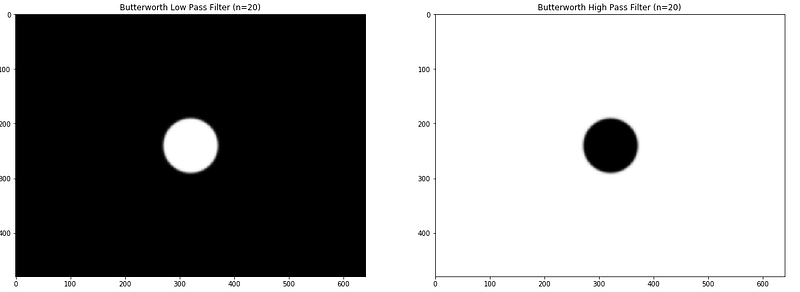
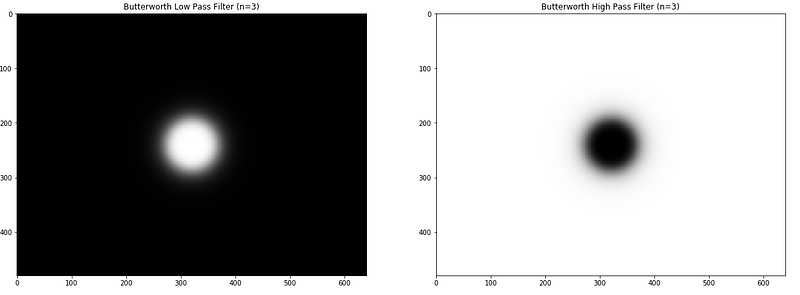
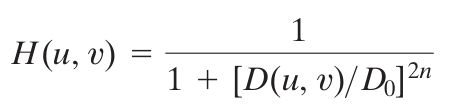
Unlike an ideal filter, a Butterworth filter does not have a sharp discontinuity that gives a clear cutoff between passed and filtered frequencies. Butterworth filter introduces a new parameter n in the function. While manipulating n, it affects the clearness of the cutoff between passed and filtered frequencies. Figure(h) and Figure(i)
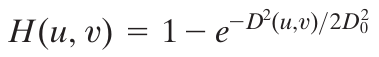
Gaussian Filter
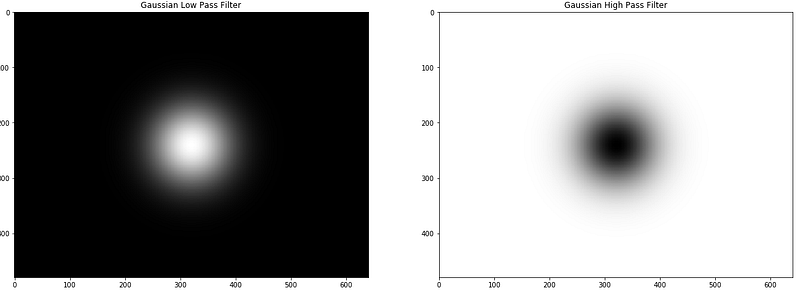
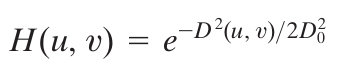
Gaussian filter is a smoother cutoff version than Butterworth. The cutoff between passed and filtered frequencies is very blurry which leads to smoother processed images.
Filter Comparison
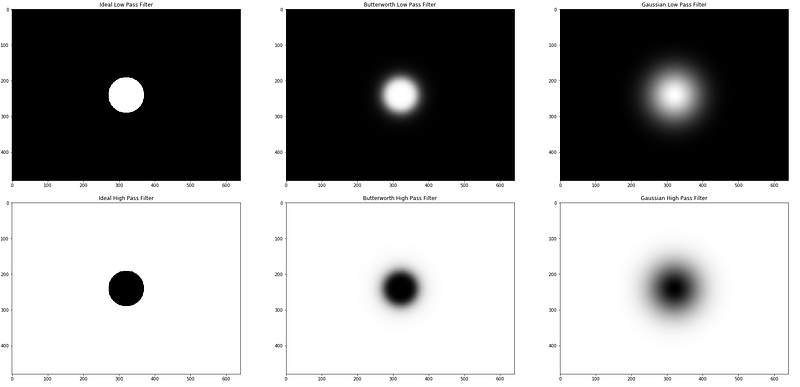
I put all different filters in Figure (k) to have a summary of what we have in filters design. From left to right, the circle becomes blurry on its edge which will lead to different impact on output results.
Butterworth filter basically is a filter between ideal filter and Gaussian filter.
Low Pass Filter Results
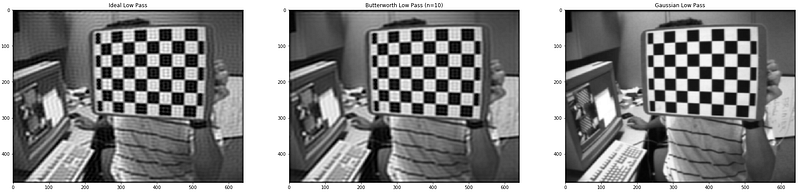
Figure (l) shows that all three filters are low pass filter because the output image preserves overall image information. Moreover, we could easily notice that the Gaussian filter performed better than other two filters due to low distortion. The reason why the ideal filter has a lot of waves noise is that the design of ideal filter blocks ALL information that is outside of certain radius from origin point. Therefore, some information will be discontinued sharply without any smooth out. On the contrary, Butterworth and Gaussian filter are smoothly blocking information that is outside of certain radius from origin point which makes image more smoothly with less distortion.
High Pass Filter Results
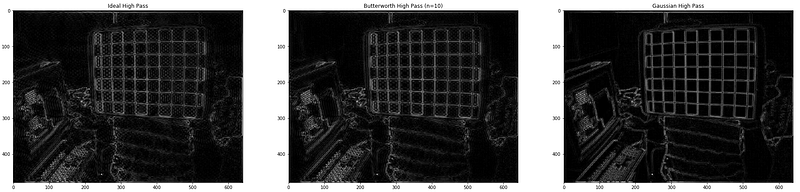
Filters in Figure (m), without doubt, are high pass filter because the output results only captured edges. The differences in high pass results between filters are similar to low pass filter results. There are a lot of distortions in an ideal filter result when compares to a Butterworth filter and a Gaussian filter.
Full Code
The End
Fourier Transformation is a very powerful tool for us to manipulate 2-dimension information. FT allows us to process image in another dimension which brings more flexibility. In this article, I go through some basic procedures using Fourier Transformation to process image. Hope you enjoy it.
Thanks for reading it. Happy coding!


