
Differences between Sobol and SHAP Sensitivity Analysis on Housing Prices Predictions
I recently applied both Sobol and SHAP to my model to get the most impactful feature, because I thought using two methods could be more convincing. However, I got inconsistent importance scores from the two methods. Consequently, I have to figure out what is wrong; life is hard.

- Test on a simple dataset(housing prices) to check if I use the methods correctly
- Searching for theoretical explanation according to the result
- Back to my problem/dataset/model to examine the differences
1. Test on a simple dataset
(1) A simple housing price prediction model
Dataset
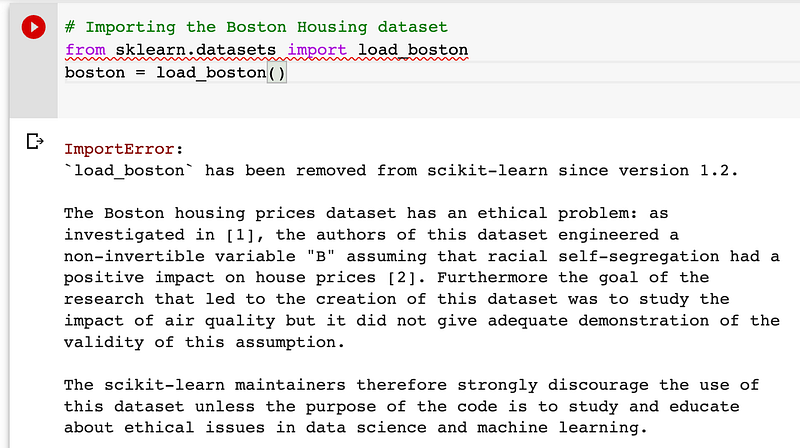
I used the California Housing Prices dataset, since the classical Boston Housing dataset is unethical, and the California dataset is suggested in the below error notice.
This dataset was derived from the 1990 U.S. census, using one row per census group. A block group is the smallest geographical unit for which the U.S. Census Bureau publishes sample data (a block group typically has a population of 600 to 3,000 people).
There are eight features, and the price is expressed in million.
# Import dataset
from sklearn.datasets import fetch_california_housing
housing = fetch_california_housing()
data = pd.DataFrame(housing.data)
data.columns = housing.feature_names
data.head()
#Adding target variable to dataframe
data['PRICE'] = housing.target
data.head()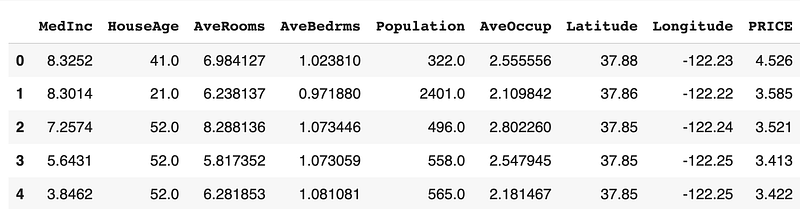
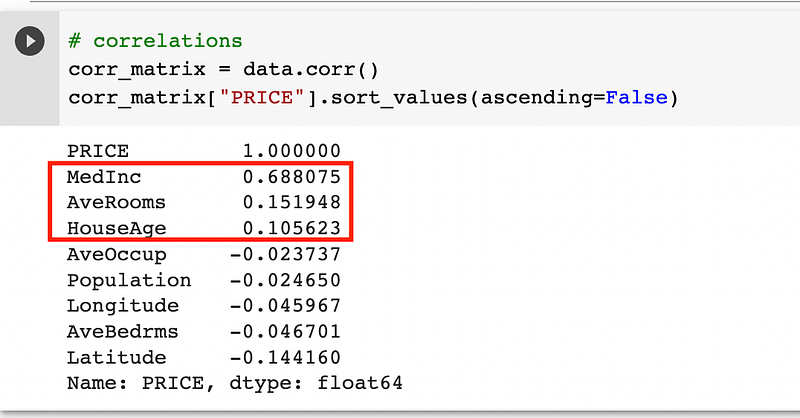
The correlations show that the most impactful feature is MedInc, followed by AveRooms and HouseAge, which make sense.
Model (RandomForestRegressor)
# Spliting target variable and independent variables
X = data.drop(['PRICE'], axis = 1)
y = data['PRICE']

# Splitting to training and testing data
from sklearn.model_selection import train_test_split
X_train, X_test, y_train, y_test = train_test_split(X,y, test_size = 0.3, random_state = 4)

# Import Random Forest Regressor
from sklearn.ensemble import RandomForestRegressor

# Create a Random Forest Regressor
reg = RandomForestRegressor()

# Train the model using the training sets
reg.fit(X_train, y_train)

# Model prediction on train data
y_pred = reg.predict(X_train)

# Model Evaluation
print('R^2:',metrics.r2_score(y_train, y_pred))
print('Adjusted R^2:',1 - (1-metrics.r2_score(y_train, y_pred))*(len(y_train)-1)/(len(y_train)-X_train.shape[1]-1))
print('MAE:',metrics.mean_absolute_error(y_train, y_pred))
print('MSE:',metrics.mean_squared_error(y_train, y_pred))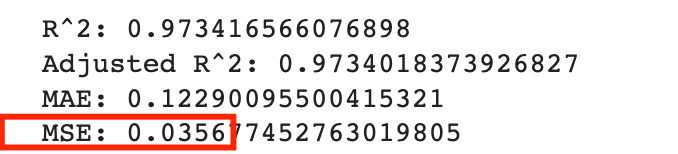
# Predicting Test data with the model
y_test_pred = reg.predict(X_test)

# Model Evaluation - Test set
acc_rf = metrics.r2_score(y_test, y_test_pred)
print('R^2:', acc_rf)
print('Adjusted R^2:',1 - (1-metrics.r2_score(y_test, y_test_pred))*(len(y_test)-1)/(len(y_test)-X_test.shape[1]-1))
print('MAE:',metrics.mean_absolute_error(y_test, y_test_pred))
print('MSE:',metrics.mean_squared_error(y_test, y_test_pred))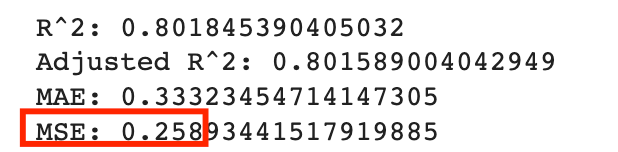
— — — — — — — — — — — — — — — — — — — — — — — — — — — — — — — — — — — —
(2) Sobol — SALib
# pip install SALib
from SALib.sample import saltelli
from SALib.analyze import sobol
from SALib.test_functions import Ishigami
import numpy as np
# Define the model inputs
problem = {
'num_vars': 8,
'names': ['MedInc', 'HouseAge', 'AveRooms', 'AveBedrms', 'Population', 'AveOccup',
'Latitude', 'Longitude'],
'bounds': [[0.49990, 15.000100],
[1.000000, 52.000000],
[0.888889, 132.533333],
[0.333333,34.066667],
[3.000000,35682.000000 ],
[0.692308,1243.333333 ],
[32.550000,41.950000],
[-124.350000,-114.470000],
]
}
# Generate samples
param_values = saltelli.sample(problem, 2**14)
# Run model (example)
Y = reg.predict(param_values)
# Perform analysis
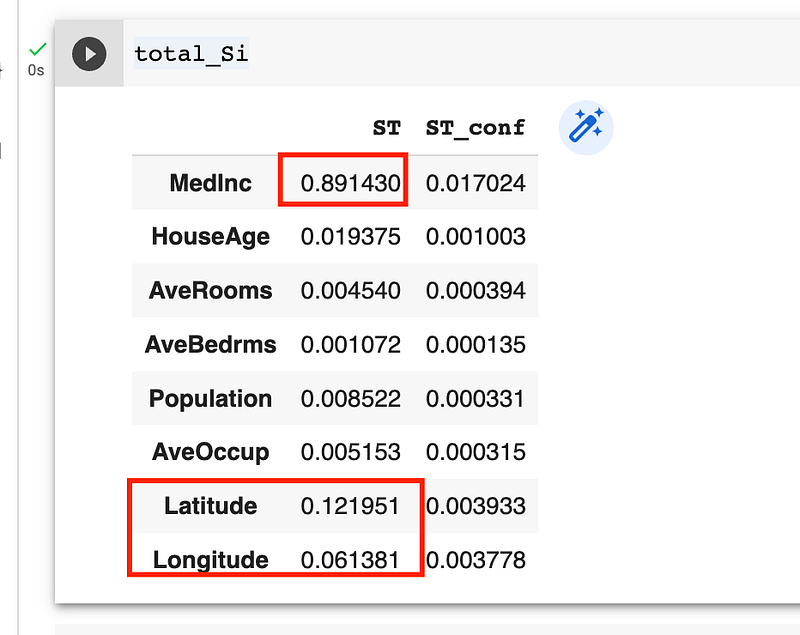
Si = sobol.analyze(problem, Y)
total_Si, first_Si, second_Si = Si.to_df()MedInc is impactful, Latitude and Longitude are more impactful than house age and AveRooms are not reasonable.
(3) Shapley Value — SHAP
import shap
shap.initjs()
model = reg
# explain the model
explainer = shap.TreeExplainer(model)
shap_values = explainer.shap_values(X[0:120])
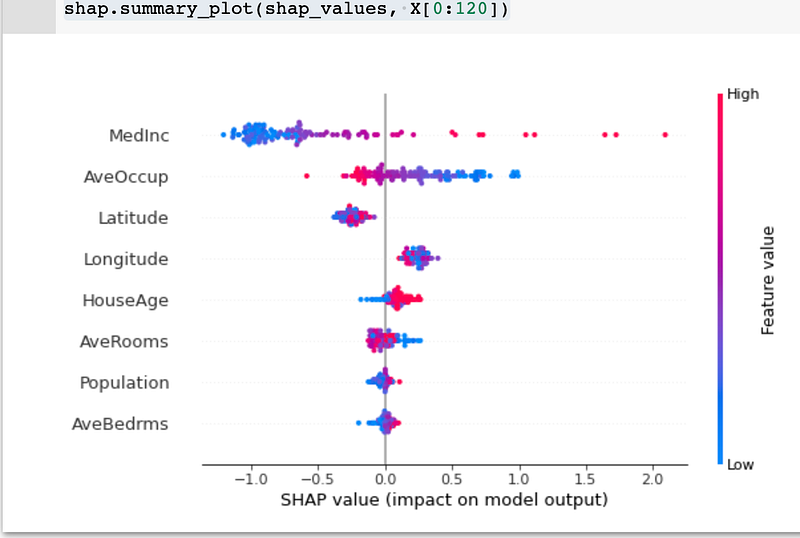
# visualize the impact of each features
shap.summary_plot(shap_values, X[0:120])SHAP gives similar results that MedInc is important, and Latitude and Longitude are also more impactful than HouseAge. The difference is AveOccup is the second impactful factor.
— — — — — — — — — — — — — — — — — — — — — — — — — — — — — — — — — — — — — -
(4) The observations
The most impactful factor is obvious and the method/libraries are used correctly. The results indicate MedInc and location are crucial.
There are differences among the rest factors. Latitude is more influential than longitude based on Sobol, and AveOccup is more impactful according to SHAP.
I overlook one preparation: I should find a dataset with proven feature importance. Thankfully, although I am not sure if the results are correct, the differences exist based on the above comparison.
I also wonder if there is a way to use the data from the dataset instead of randomly drawn from a range.
2. Searching for a theoretical explanation
I found the thread in the SHAP GitHub issue page. I googled the differences between Sobol and SHAP, and that paper mentioned in their discussion was also at the top of search results.


To be honest, I don’t understand Slundberg’s comment and the paper. But it seems SHAP is more convincing.
3. Back to my problem/dataset/model
According to the housing price dataset analysis, the differences in the importance scores between these two methods seem small because the top impactful feature is consistent.
This is not my case; I’d like to check how I used SHAP on my dataset again tomorrow.


