
Determining Sample Sizes for A/B Testing Using Power Analysis
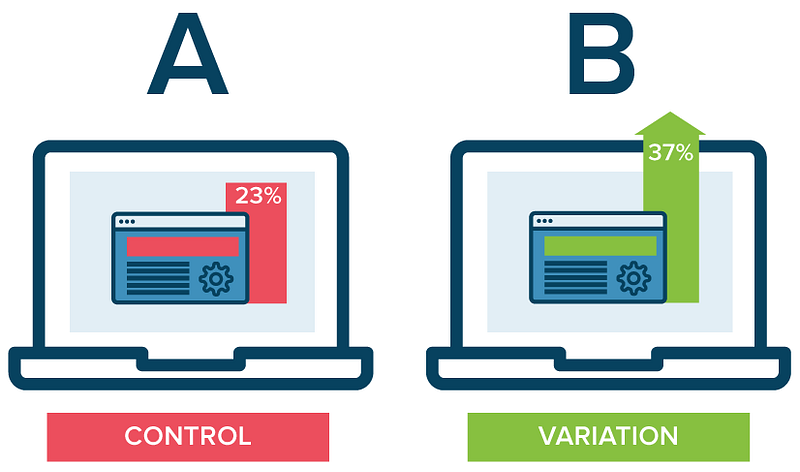
A/B tests are ubiquitous today as a tool for designing just about anything. They are often looked to as a more objective way of answering the age-old question of, “which is better?” by quantifiably measuring success. In my eyes, the process of conducting an A/B test has always epitomized the “science” in data science. It shares many elements with randomized controlled trials (RCTs), which are not only the gold standard of clinical trials, but also psychology laboratory experiments, by creating a setup designed to isolate and measure the effect of changing what one group sees vs. another.
However, the question of sample size (i.e. “how many people do I need to test on?”) is frequently asked, as testing takes time, and time is money. Ideally, as soon as you have a confident answer to your question, you can choose the winner and stop using the inferior version. By using a power analysis to determine sample size, you can get a better sense up front about how long a test will need to run before it can confidently confirm or refute your hypothesis.
What is a power analysis?
In order to determine the minimum sample size required for running a statistically robust test, an a priori power analysis can be done. A priori refers to the fact that the analysis is occurring before collecting results. A power analysis considers the relationship between 4 parameters:
- effect size (e.g. Cohen’s d or h): a standardized way of calculating the magnitude of an effect observed in an experiment; the exact statistic depends on what is being compared and the hypothesis test being used: for differences between two means, Cohen’s d is frequently used, while Cohen’s h is specifically for differences between two proportions
- sample size (n): number of observations or people used in a study or experiment
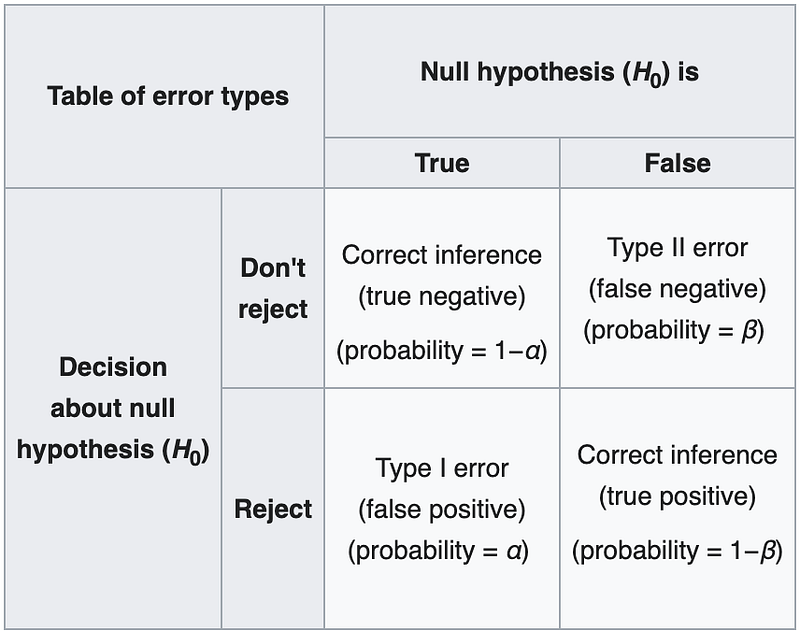
- significance level (⍺, often calculated as a p-value): commonly thought of as a threshold that must be met to deem the results legitimate; this number actually means is that if a test is repeated infinite times and there is no real effect, the results observed would still happen by chance ⍺% of the time (also known as a Type I error, or false positive)
- power (1-β): the probability of being right when you do determine that there is a significant difference in the results; β refers to the chance of getting a false negative (or Type II error), where you’re saying there’s no effect when there is in fact one, so power is expressed as 1-β
Any of these parameters can be solved for if given the other 3; terminologically speaking, a priori implies that this analysis is done before an experiment is run in order to calculate required sample size from the other 3.
There are a number of libraries and freeware that support functions for power analysis, which I have linked to at the end of this article; for this article, I will be using Stephane Champely’s R package pwr.
A practical step-by-step methodology for estimating sample size
Before diving into an example in the next section, here’s an outline of the general procedure you can apply to a wide variety of A/B testing use cases:
- Contextualize the intervention/treatment and come up with an initial hypothesis; determine whether the experiment is one- or two-sided*
- Set clear desired benchmarks for power and significance level (0.80 and 0.05 are considered defaults, respectively)
- Estimate effect size based on prior data, results, research, etc. - For proportions, can consult Cohen’s h; else, Cohen’s d - Can start with current/historical baseline conversion rates/averages in most cases as a reference point; otherwise, a pilot test could suffice
- Calculate sample size using a priori power analysis - (Optional) Depending on the stakeholder, it may be useful to project the time required to reach sample size (e.g. if testing on users visiting a web page)
- Run test with 50–50 split until sample size reached and evaluate - Evaluate results by running the appropriate hypothesis test** - If not significant, the effect size may be smaller than originally expected, so a larger sample size would be needed to validate it*** - If sample size not reached, but evaluation desired, significance will likely only be found if the effect size is bigger than originally
- If more data is wanted, continue to run test with a more lopsided split and monitor results in accordance with business metrics until sufficiently confident
*Unless very confident in the directionality of the results, use two-sided tests; otherwise, there is a risk of estimating a smaller sample size than actually needed.
**Common tests: - Proportions: Z-test (e.g. conversion rate, open rate) - Means: t-test (e.g. # of actions, $ spent)
***Of course, it may be reasonable here to conclude the test and determine there to be no significant difference from whatever intervention is being tested. In general, it is a good practice to reevaluate at this planned stopping point to decide whether further testing is worth it (additional technical resources, time, etc.) and try to understand why the results have not made as large of an impact as originally expected.
Note: If randomly splitting from the same population is not an option for A/B testing (e.g. comparing two “similar” countries instead), then may want to consider distributions or related metrics that should be held constant (this article does a good job of going over how to determine these metrics).
Example: A/B testing different homepage banners on an online shopping site
Let’s say that we work for a clothing brand planning to launch a new seasonal collection. As part of the launch, we are planning to feature this collection on the top banner of our homepage, with the goal of maximizing clickthrough rate (CTR). Someone suggests a new idea of advertising a sale alongside the launch in our banner to entice more visitors, so our Product team proposes running an A/B test on a test audience in order to decide which banner gets used for the public launch and asks us to determine how many people we need for this.
First, we need to find the proportion of users in our segment that we expect to click on this banner. Looking at previous collection launches, we can get a baseline for how well our banner usually performs: let’s say this CTR is 5%. From here, we need to estimate how much lift we expect a sale to bring.
Suppose we also know that launches and sales attract some of the same people. Since promotions are a major driver for our customers, our CTR for these banners have usually been in the 10–20% range, which ultimately might lead us to a conservative estimate that a banner featuring both a sale and launch concurrently will have a 15% CTR.
We can calculate effect size (Cohen’s h) from this, and plug it into our power analysis function to get the minimum desired sample size, which is 132 (per group) if we use our default benchmarks for significance and power.
# Simple power analysis example in R
> library(pwr)
# Calculate Cohen's h
> ES.h(.15, .05)
[1] 0.344372
# Leave n blank here to produce sample size; two-sided indicates that we are test for a difference in either direction
> pwr.2p.test(h = 0.3444, n = , sig.level = 0.05, power = 0.80, alternative = "two.sided") Difference of proportion power calculation for binomial distribution (arcsine transformation) h = 0.3444
n = 132.3458
sig.level = 0.05
power = 0.8
alternative = two.sidedNOTE: same sample sizesNow again, factors should be well-controlled here. If we are launching during a holiday season, our sales messaging might resonate differently with our customers than if were just a random weekend. If the site recently underwent a redesign, then past data may be invalid to use as a basis of comparison. Similarly, there are a myriad number of factors to consider about the release itself that might affect customers’ anticipation and expectation levels.
For example, if our collection features a collaboration with a well-known artist, we might expect a higher baseline and expected CTR due to the buzz, which would affect our effect size, which would then affect our sample size:
# Suppose we added a flat 5% to everything
> ES.h(.2, .1)
[1] 0.2837941
> pwr.2p.test(h = 0.2838, n = , sig.level = 0.05, power = 0.80, alternative = "two.sided")
Difference of proportion power calculation for binomial distribution (arcsine transformation) h = 0.2838
n = 194.9
sig.level = 0.05
power = 0.8
alternative = two.sidedNOTE: same sample sizesRegardless of the test, it is always crucial to think through all the factors that can affect not only your experiment, but also your overarching goals. For instance, in our example, maximizing clickthrough rate might not actually improve sales. If we wanted to optimize for dollars spent, we could perform a different power analysis, knowing that we would eventually use a hypothesis test for comparing means (such as a t-test) rather than proportions. Fortunately, our methodology would remain quite similar — instead of looking at historical conversion rates, we might simply look at the success of previous sales to benchmark a new effect size.
It can be hard to estimate effect sizes, especially if you are performing A/B tests for the first time and there is a lack of previous data. Accepted benchmarks for effect size can be substituted if metrics are truly unknown (0.2 = small; 0.5 = medium; 0.8 = large), but only experience over time can help you gain an intuition of how effect translates to your business applications. Testing on a larger sample will generally always improve the precision and confidence in the results, but this obviously happens at the cost of resources, whether that means time, developer resources, or the cost of experimentation itself.
A/B tests are a powerful tool that can help you rapidly reiterate and evolve your designs. By taking a scientific approach, you can whittle down lists of ideas to uncover the best candidate(s). Often times, the results of A/B tests can lead you to new and surprising insights, which will help deepen your understanding of your consumer base and sometimes force you to rethink your prior assumptions.
Developing an infrastructure and methodology to support and measure A/B tests can be the first step to unlocking all of this, but of course, it is always important to keep the big picture in mind. Tunneling on a particular success metric may come at the cost of neglecting how a change impacts different segments of your base, which not only has ethical ramifications but also may impact the long-term trajectory of your business. Because of this, it is always important to think critically about how and when to use tools like A/B tests and consider all relevant contexts when interpreting results.
Helpful libraries and tools
pwr Package (R): popular R package specifically for power analysis
statsmodel: Python statistics library containing Z-test & t-test power analysis functions:
pingouin: Python library which has ported over some power functions in R's pwr package
G*Power: free tool for Windows/Mac for running power analyses, used across academia
Related articles and resources
Academic
Why perform a priori sample size calculation? (Canadian Journal of Surgery, 2013): explanation of the why/how of a priori power analysis, from an academic medical perspective
Introduction to Power Analysis (UCLA, Institute for Digital Research & Education: Statistical Consulting): high-level overview of how to understand power analysis
Power and Sample Size Determination (Boston University School of Public Health): textbook-style module on sample size and power analysis
Industry
Statistical Power: What You Need to Know for A/B Testing (CXL): basic explanation of the 4 parameters in power analysis and examples shown through G*Power
How To Calculate A/B Testing Sample Size (investp): overall overview of approaches to calculate sample size
Don’t fight the power (analysis) (Cookie Scientist): article that goes over interpretation of power before/after an experiment
Understanding effect size
Interpreting Cohen’s d Effect Size: An Interactive Visualization (R Psychologist): helpful visualization on what Cohen’s d looks like as a function of distributions between two sample groups
Cohen’s h (Wikipedia): general overview of Cohen’s h
Why sample size and effect size increase the power of a statistical test (The Startup): Medium article explaining some of the intuition between power and sample size/effect size, with visualizations


