
Determine The Best Time To Post Content On Social Media Using Python
How to use Python and Reddit’s API to collect hourly active user data and determine the highest traffic times.
Reasoning
Not long ago, I started woodworking and wanted to share my projects with the woodworking communities on Reddit and other social media platforms. I noticed that some posts did better than others even though the content and quality were roughly equivalent. This led me to believe that when I make my posts must play a role and that I could use my skills as a data scientist to optimize my posting schedule.
I chose to do my analysis on Reddit instead of Instagram, YouTube, or TikTok for a few reasons. First and foremost, Reddit has subreddits that are communities of people-centered around a specific topic. This makes it easy to specify my analysis, to say, just the woodworking community, instead of the entire platform user base. Other social media platforms do not have this level of compartmentalization for their communities. You can look at posts with certain hashtags, but you can’t easily look at a group of users who follow that hashtag.
The second key reason I chose to do my analysis on Reddit is that Reddit shows current active users for any given subreddit. You can see in real-time how many people are browsing any particular subreddit.
The third and final reason is that Reddit has an easy-to-use API which should make collecting this data simple compared to trying to scrape this type of data from the web.
Assumptions
There are a couple of assumptions I will be making during this analysis.
- Higher active user numbers correlate to a better time to post. However, a counterargument could be made that the more active users, the more posts will be made and the more competition for attention there will be. either way, you can still use this guide to collect the data and then analyze it however you wish.
- People browse Reddit at the same time that they browse other social media platforms and thus this analysis applies to other social media. This one is anecdotal, but I find that I make the rounds between all social media in the same sitting. I’ll scroll through Instagram, then Tiktok, Reddit one after the other.
Getting a Reddit API Client ID and Secret
There are many tutorials online for getting a Reddit client ID and Secret. I will quickly go over the steps here but if you run into trouble I suggest you Google ‘Reddit API’
- You will need a Reddit account. Create one if you don’t already have one
- Go to Preferences -> Apps -> ‘are you a developer…’
- Name it whatever you want
- Select the ‘Script’ Option
- Give it whatever description you want
- Leave ‘About URL’ blank
- enter ‘http://localhost:8080’ in ‘redirect URL’
- Copy your client ID and Secret for use later
Collecting the Data
It’s finally time to do some coding.
Create a new directory where you will save a few python and CSV files. This will make cross-referencing the files easier down the road. I named mine ‘active_user_data’.
Open up a new .py file in your favorite text editor and save it inside the ‘active_user_data’ directory. I named mine ‘active_users.py’
Import the following libraries.
import praw  # Reddit API
import csv
from datetime import datetime
Use ‘PRAW’ to log into Reddit. You’ll need your client_id and client_secret from setting up your API key earlier as well as your username, and password
reddit = praw.Reddit(
client_id="XXXXXXXXXXXX",
client_secret="XXXXXXXXXXXXXXXXXXXXXXXX",
user_agent="Users",
username="XXXXXXXX",
password="XXXXXXXX",
)
Define the subreddits you want to get data for. This can be just one subreddit or multiple. Later you will normalize all the data. For my purposes, I chose various woodworking and maker subreddits.
woodworking = reddit.subreddit("woodworking")
beginnerwoodworking = reddit.subreddit("beginnerwoodworking")
woodworkingplans = reddit.subreddit("woodworkingplans")
woodworkingvideos = reddit.subreddit("woodworkingvideos")
garageporn = reddit.subreddit("garageporn")
somethingimade = reddit.subreddit("somethingimade")
toolporn = reddit.subreddit("toolporn")
workbenches = reddit.subreddit("workbenches")
The data will be collected on a loop at some user-specified time interval. But before the loop can be set up, you need a way to store the data you are going to fetch. So first, create a list of field names that will act as the column names of your data and then an empty dictionary.
Field names:
field_names= [
'woodworking active users' ,
'beginnerwoodworking active users',
'woodworkingplans active users' ,
'woodworkingvideos active users',
'garageporn active users',
'somethingimade active users',
'toolporn',
'workbenches',
'date']
Empty Dictionary:
users_dict = {
"woodworking active users": [],
"beginnerwoodworking active users": [],
"woodworkingplans active users": [],
"woodworkingvideos active users": [],
"garageporn active users": [],
"somethingimade active users": [],
"toolporn active users": [],
"workbenches active users": [],
"date": [],}
Set the amount of time you want this loop to run. This is set to run for 28 days from when you run the script.
t_end = time.time() + 60 * 43801Now create the loop.
while time.time() < t_end:For each iteration of the loop, you will
- Gather the date and time:
now = datetime.now()- Fetch each of the subreddits
woodworking._fetch()
beginnerwoodworking._fetch()
woodworkingplans._fetch()
woodworkingvideos._fetch()
garageporn._fetch()
somethingimade._fetch()
toolporn._fetch()
workbenches._fetch()- Append the ‘active_user_count’ and date onto the corresponding dictionary entry
users_dict["woodworking active users"].append(woodworking.active_user_count)users_dict["beginnerwoodworking active users"].append(beginnerwoodworking.active_user_count)users_dict["woodworkingplans active users"].append(woodworkingplans.active_user_count)users_dict["woodworkingvideos active users"].append(woodworkingvideos.active_user_count)users_dict["garageporn active users"].append(garageporn.active_user_count)users_dict["somethingimade active users"].append(somethingimade.active_user_count)users_dict["toolporn active users"].append(toolporn.active_user_count)users_dict["workbenches active users"].append(workbenches.active_user_count)users_dict["date"].append(now)- Export/overwrite the dictionary as a ‘userdata.csv’ file. This code block creates or opens the ‘userdata.csv’ file and writes the information from our dictionary into a standard dataframe format that you will use later in the analysis section.
keys=sorted(users_dict.keys())
with open ("userdata.csv" , "w") as outfile:
writer=csv.writer(outfile, delimiter = "\t")
writer.writerow(keys)
writer.writerows(zip(*[users_dict[key] for key in keys]))- Print one of the counts and date/time to the terminal
print("woodworking active user count:",woodworking.active_user_count)
print(now)- Wait 1 hour before repeating. This can be changed to whatever time interval you want.
time.sleep(3600)Let this script run until completion. I ran it on an extra Raspberry Pi I had laying around so I didn’t have to worry about it on my main machine. Come back to the next section once it's complete.
You can find this script as well as the following analysis script on my Github in the links below.
Analyze Your Data
Create a new file in your ‘active_user_data’ directory called ‘analysis.py’. This must be in the same folder/directory as your ‘active_users.py’ and ‘userdata.csv’ files.
Import the following libraries:
import pandas as pdimport matplotlib.pyplot as pltimport seaborn as snsRead in your ‘user_data.csv’ file as a Pandas dataframe:
df = pd.read_csv('userdata.csv', sep = '\t')If you print ‘df’ it should look something like this:
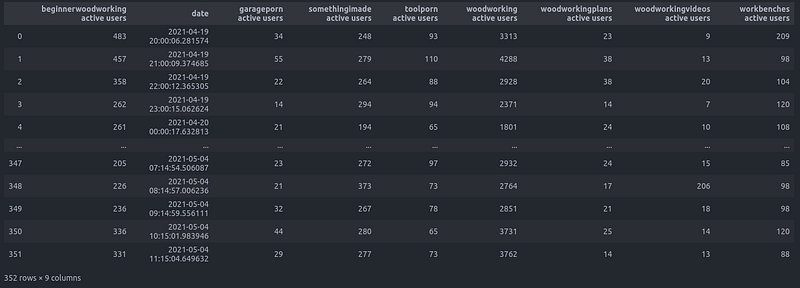
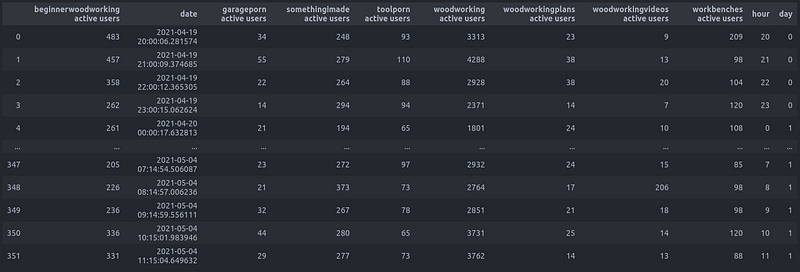
The ‘date’ column is currently a data type of string. Change it into a datetime object and create ‘day’ and ‘hour’ columns:
df['date'] = pd.to_datetime(df['date'])df['hour'] = df['date'].dt.hourdf['day'] = df['date'].dt.dayofweekIf you print ‘df’ again, you should see two new columns, ‘day’ and ‘hour’, represented numerically:
Take notice that the user counts between different subreddits can vary drastically. Normalizing these values will allow for direct comparison. If you only collected data from one subreddit, you can skip this step.
Create a list of the dataframe columns excluding those that you do not want to include in the normalization: ‘date’, ‘hour’, and ‘day’.
my_col = list(df.columns.values)
my_col.remove('date')
my_col.remove('day')
my_col.remove('hour')
Iterate through the columns and replace the user count values with the normalized values.
for column in my_col:
maximum = df[f'{column}'].max()
minimum = df[f'{column}'].min()
my_range = maximum - minimum
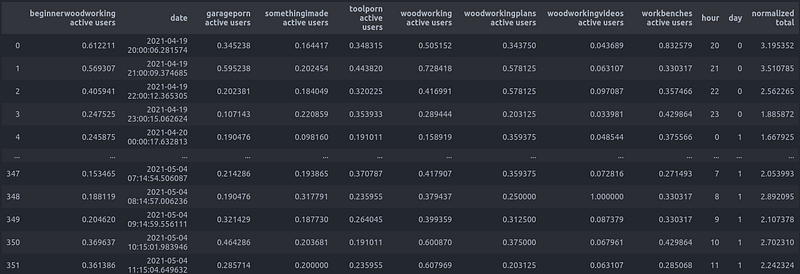
df[f'{column}'] = (df[column] - minimum) / my_rangeNow get a sum of all the normalized values for each row. Add this as a new column:
df['normalized total'] = df[my_col].sum(axis = 1)Printing out df again, you should see all the user values now between 0 and 1 as well as a new ‘normalized total’ column on the far right.
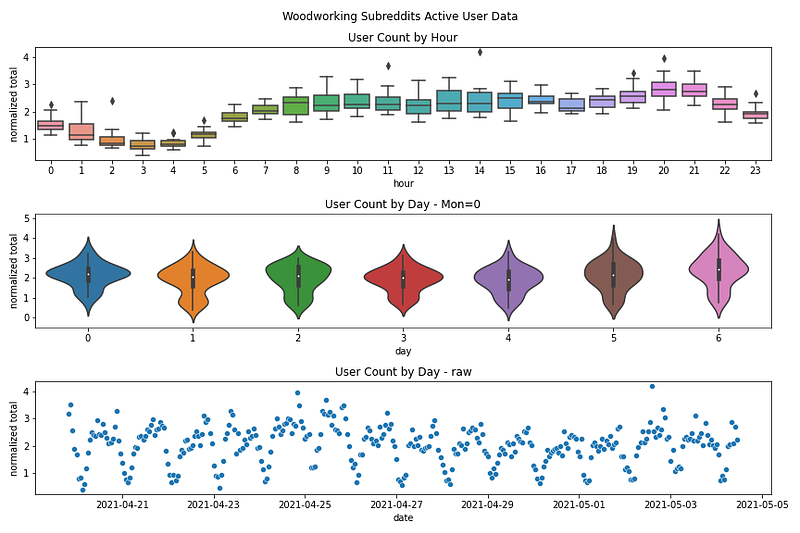
First, plot just a single subreddit. I chose three different plots to look at. A box plot showing the user count by the hour of the day, a violin plot showing the user count by day of the week, and a scatter plot that shows the entire time series.
fig, axes = plt.subplots(3,1)fig.set_size_inches(12, 8)fig.suptitle("Woodworking Subreddits Active User Data")axes[0].set_title('User Count by Hour')axes[1].set_title('User Count by Day - Mon=0')axes[2].set_title('User Count by Day - raw')sns.boxplot(ax = axes[0], data = df, y ='woodworking active users',x = 'hour')sns.violinplot(ax = axes[1], data = df, y ='woodworking active users',x = 'day')sns.scatterplot(ax = axes[2],data=df, x='date', y='woodworking active users')fig.tight_layout()plt.show()fig.savefig('userdata.png')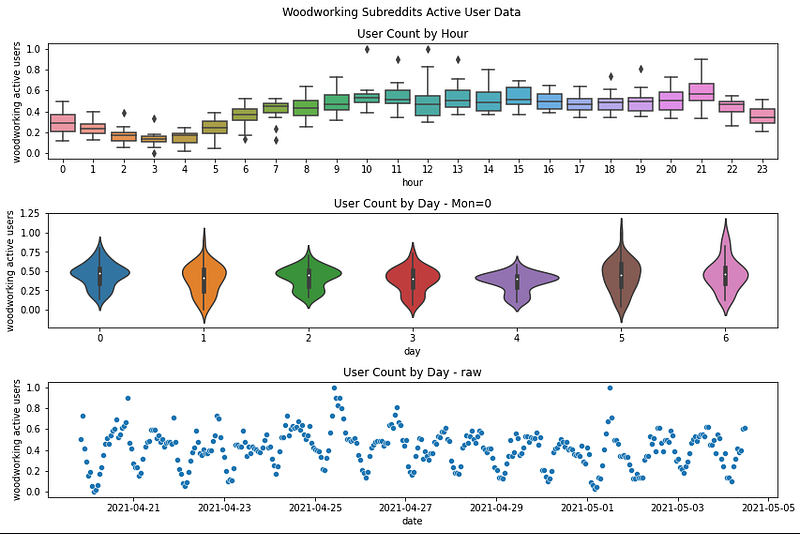
From the scatter plot you can clearly see there are high points and low points throughout the week. From the Violin plot, you can clearly see the distribution of user count throughout the weekdays. This shows that while Friday (day 4) does not have the highest average users per day (white dot in the center of the violin plot) it has a very tight distribution. Finally, the box plot shows us the times of day that have the highest user counts. Mid to late evening looks to be the most active time. This leads to the conclusion that Friday evening is one of the best times to make a new post on r/woodworking!
This was just one subreddit though. Re-plotting using the normalized totals will give a more holistic view of the woodworking communities.
fig, axes = plt.subplots(3,1)fig.set_size_inches(12, 8)fig.suptitle("Woodworking Subreddits Active User Data")axes[0].set_title('User Count by Hour')axes[1].set_title('User Count by Day - Mon=0')axes[2].set_title('User Count by Day - raw')sns.boxplot(ax = axes[0], data = df, y ='normalized total',x = 'hour')sns.violinplot(ax = axes[1], data = df, y ='normalized total',x = 'day')sns.scatterplot(ax = axes[2],data=df, x='date', y='normalized total')fig.tight_layout()plt.show()fig.savefig('userdatanormalizedtotal.png')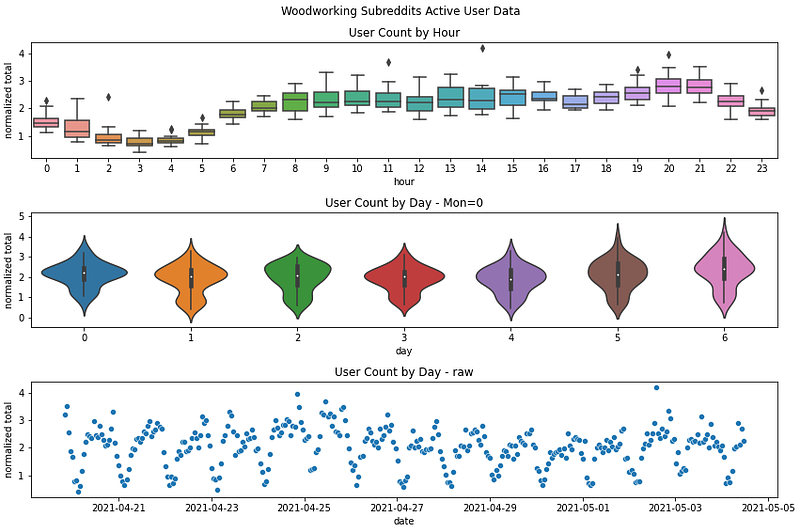
Here a similar analysis can be done. Sunday may have the highest average number of users, but they are distributed all throughout the day. Monday has the tightest distribution and around 8 PM looks to be the most active hour. So Monday evening looks to be the best time to make posts in general!
Conclusion
This data was only collected throughout a couple of weeks. A more robust analysis would use months to years of data.
Further, this brief analysis has provided a hypothesis on the best times to post content on social media, but a lot of questionable assumptions were made to get to that hypothesis. Do more active users = better time to post? Is a tighter distribution better than a total number of users? Can results from this Reddit analysis be applied to other social media platforms? In Part II, I’ll take a deeper look at these assumptions and try to test the hypothesis.
Finally, I hope this tutorial has helped you on your quest for maximal likes, upvotes, and shares and has given you the tools to collect your own data and make your own analysis.
Links
https://www.instagram.com/firthfabrications/
More content at plainenglish.io. Sign up for our free weekly newsletter. Get exclusive access to writing opportunities and advice in our community Discord.


