
Descriptive Statistics
Basic statistics concepts that helps to understand the data better.
What is descriptive statistics?
It is a summary of statistics that describes basic features of the data. It provides simple summaries about the sample and it’s measures.
Descriptive statistics displays details about the data but does not make any inferences. To make inferences we use inferential statistics
So let’s start with the very basics
Different types of data
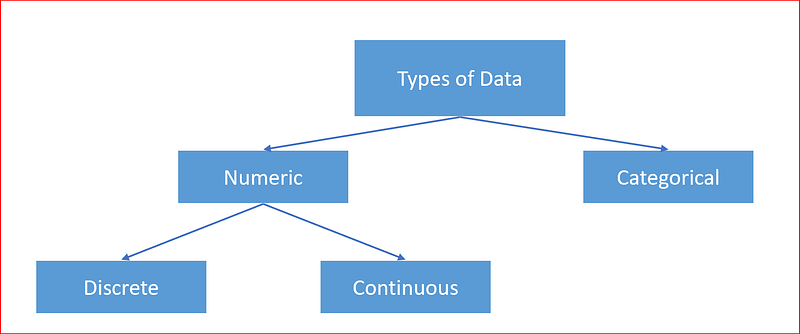
Data can be divided into
- Numerical
- Categorical.
Numerical as the name suggests is related to numbers. It can be continuous like GPA score of a student with score of 4.6 or the cost of an item with a value $23.4 or a stock price of stock listed at $98.99
Numeric data can discrete like age of a person like 28 years old or number of ice creams you ate this week, which could be 3 ice creams.
Categorical data represents categories or groups like designations in a company — Analyst, Manager, Director, VP etc. or seating in a plane — Economy or Business class.
let’s take our sample dataset from Titanic and try to understand the descriptive statistics.
Titanic dataset and data dictionary is available here -https://www.kaggle.com/c/titanic
Sample output from the Titanic dataset
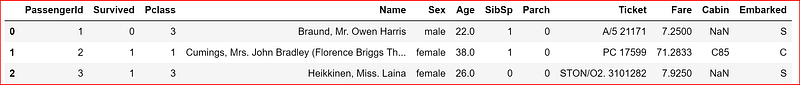
Categorical features in the above data set are
- Survived column with values 0 and 1 where a value of 0 signifies the person did not survive and a value of 1 signifies the person survived
- Pclass with values 1, 2 and 3
- Sex, which is gender with values male and female
- Embarked with values S, Q and C
Discrete features are
- Age,
- SibSp and
- Parch
Continuous feature is
- Fare
Levels of measurements
Describes the nature of the information within the values of the variable. A variable can be described having one of the four levels of measurements
- Nominal,
- Ordinal,
- Interval or
- Ratio
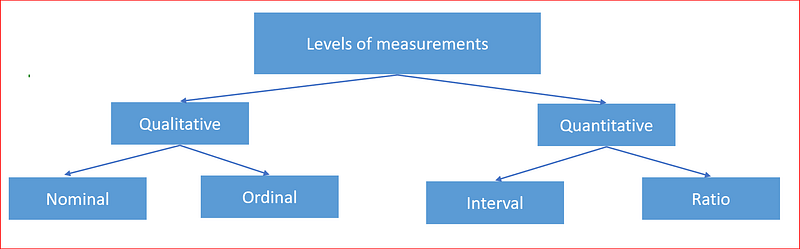
Broadly we can have describe the information as
Qualitative, which is values that are non numeric and can be placed into categories.
Further Qualitative variable can be Nominal or Ordinal.
Nominal, where categories can be placed in any order. No ranking or order exists. like the column sex containing values male and female are nominal as there is no rank or order to gender.
Ordinal where categories can be ordered like column Pclass where we have first class, second class and third class in that order
Quantitative, which are numeric values consisting of counts or measurements.
Quantitative variable can be divided into Interval and Ratio.
Interval — classifies and orders the measurement from low to high and also ensures distance between each interval on the scale is equivalent. An example would be temperature where distance between 75 and 76 degrees is same as distance between 90 and 91 degrees.
Ratio — In this level of measurement, in additional to having equal interval it can have a zero value.
let’s explore some common terms used in descriptive statistics
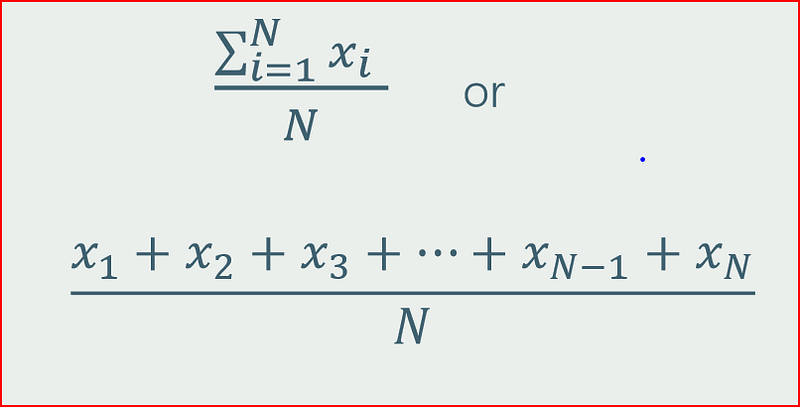
Mean — Mean is the average of all the observations in the dataset. Outliers greatly impact the mean. Most common and widely used spread of central tendency
Please refer to my POST for understanding data
data_set.describe(include='all')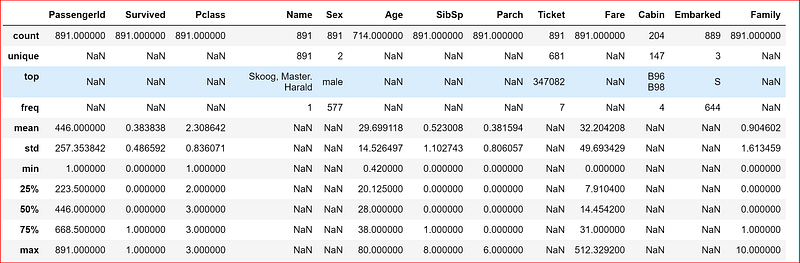
Mode : value that occurs most often in the dataset.
for example if we have a dataset with values 1,3,4,6,4,3,1,2,3 then the value that occurs most often is 3 and that is Mode of the dataset
Median : Middle point of the ordered dataset. In an ordered dataset median is (n+1)/2 where n is the number of observations in the dataset.
If the number of observations are even then we take the average of the two numbers closest to the value obtained by (n+1)/2
for example if we have an ordered dataset with values 1,3,4,6,10,13,15,17 which has 8 observations, so the we will take the average of 4 and 5 positions which is 6 and 10, so median will 8
Advantage of median is that it is not skewed by outliers which can be either too small or too large a value
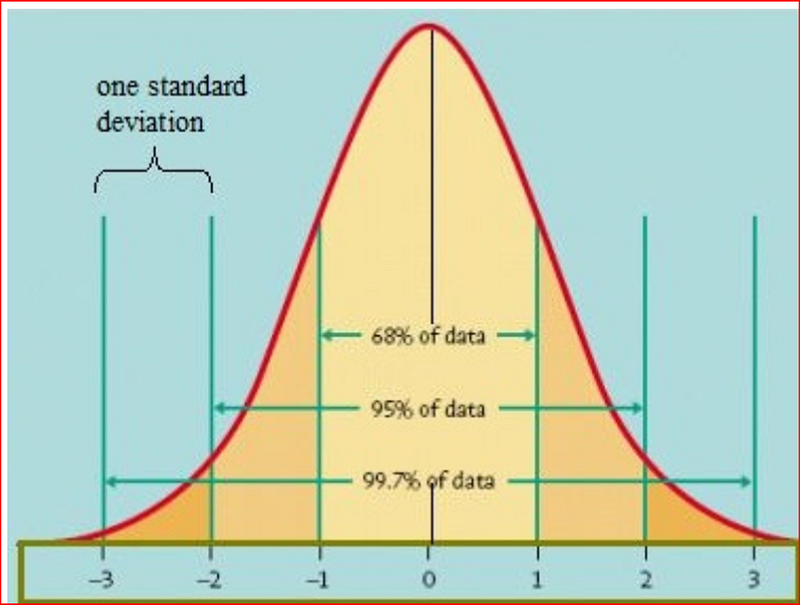
Variance and Standard deviation
Both variance and standard deviation measures dispersion of data points around the mean value.
There are different formula for Sample and Population.
Population is entire collection of individuals or data points that you want to study whereas Sample is a small subset of the population
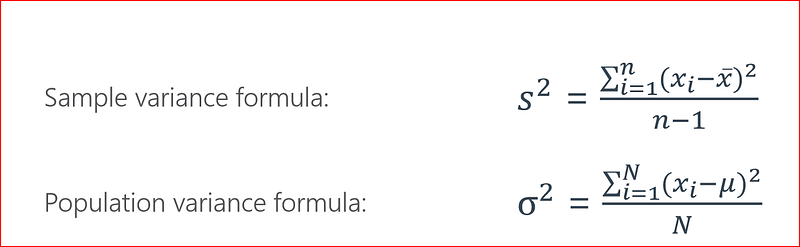
Variance is the average square of the deviation of each observation from mean value.
Standard deviation is the square root of the variance
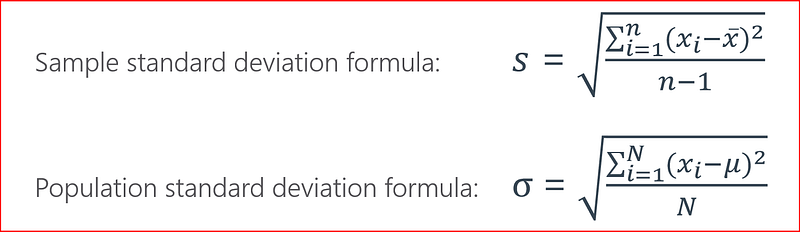
Standard deviation has the same unit of measurement as the original observation
since variance and standard deviation are based on mean they are highly influenced by outliers
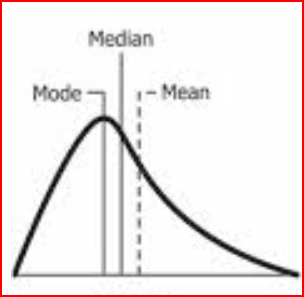
Skewness
it is the measure of the asymmetry that indicates if the observations are concentrated on one side.
A bell curve has a symmetric distribution which means that left and right side are mirror images .
Positively skewed data has a long tail on the right side. Here mean and median is greater than mode
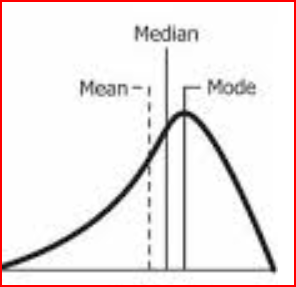
Negatively skewed data has a long tail on the left side. Here mean and median is less than the mode
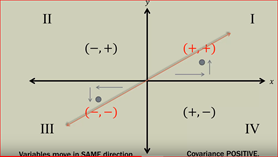
Covariance is the measure to specify if two variables vary together.
It is about the direction of change between two variables. The strength of the relationship between two variables is determined by correlation.
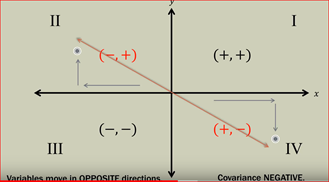
It can be positive covariance, near zero or negative covariance
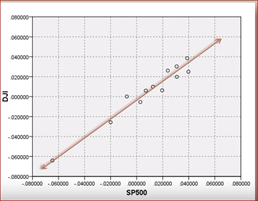
When a change in one variable has a linear impact on the other variable. In the below example Dow Jones linearly varies with S&P.
Covariance has no upper or lower bound and its scale is dependent on the scale of the variables
The linear relationship can be positive or negative
Positive Covariance: when an increase in one variable has a similar impact on the other variable
Negative covariance: when an increase in one variable has opposite effect on the other variable
Correlation is when a change in one variable may result a change in another variable unlike covariance which determines how two variables vary with each other.
Correlation tells us how two variables are related to each other
Correlation varies between +1 to -1 and is standardized.
Value of correlation is independent of the scale of the variable and is the reason why it is sometimes preferred over covariance
An example of correlation is how outside temperature and energy consumption is related to each other. An increase in outside temperature causes increase in energy consumption to use an air conditioner.
Both temperature and energy consumption are in different units but there correlation is always be within +1 and -1
Correlation is represented by r -pearson coefficient
Correlation of 1 means if one variable increases it will cause the other variable also to increase.
Correlation of 0 means there is no relationship between the two variables
Correlation of -1 means when one variables increases it will cause the other variable to decrease
Correlation does not always mean causation


