
Decoding Statistical Significance: A Marketer’s Guide
Marketing Measurement-3: A layman’s guide to understand statistical significance while measuring marketing effectiveness.

Have you ever wondered how marketers determine the effectiveness of their campaigns? In today’s data-driven world, understanding the concept of statistical significance is crucial for making meaningful conclusions about marketing impact. Join me on a journey to demystify this essential statistical concept and learn how it can shape marketing decisions.
The Growth of “Marketing Impact”
Google Trends reveals a significant surge in interest surrounding “Marketing Impact” (appendix 1.1). The term resonates in boardrooms, representing the pursuit of proving marketing’s value by measuring marketing’s effectiveness and achieving a return on investment.
This article is a continuation of the series on ‘Measuring Marketing Effectiveness’, in case you missed the previous parts, here is a quick recap:
- In Part 1 we highlighted the superiority of experimental design, AB testing, or test-control analysis as the best-in-class methodology for measuring marketing interventions.
- Part 2 double-clicked into “Marketing Incrementally” via the Test-Control framework and emphasized the importance of formulating hypotheses (both Null and Alternate) in Part 2.
Understanding the Need for Significance.
Now, let’s delve deeper into the concept of “Marketing Impact.” It’s all about quantifying the incremental effect of marketing interventions compared to a baseline scenario without marketing. In essence, we’re examining the difference between two behaviors:
- Marketing exposed behavior (represented by the Test group)
- Baseline behavior (represented by the Control group)
.. Consider the example we used in Part 2: Apple running a marketing intervention (ads) to promote their new iPhone to a small group of people. We designed an experiment to measure the impact and randomly divided our subjects into two equal groups: Group A, exposed to the ad (the test group), and Group B, not shown the ad (the control group).
To understand the ‘marketing impact’ via quantitative user behavior; we decided to look at the sales of iPhones of the two groups during the campaign and form our hypothesis:
Null Hypothesis, H0: No Impact of marketing Alternate Hypothesis H1: Impact of marketing
Researcher’s process: As a researcher, you always start by assuming the status quo, the neutral Null Hypothesis (H0) being true (that is, no significant difference) and look at the current evidence to reject or not reject it.
Evidence, in this case, represents the “sample” at hand; that is, the data of iPhone buying behavior (i.e. sales) of people in Test and Control groups; so the quantitative version of our hypothesis becomes: H0: Test_Sales = Control_Sales H1: Test_Sales != Control_Sales
Note that, we refer to our Test/Control user’s purchase data as “sample”.
→ In the world of statistics we rarely know the population and we always observe a “sample”— one of many possible outcomes if the same activity (here, a marketing intervention) is repeated again and again. And in other repetitions, we might get a “sample” that is widely different from the ones we see currently.
Now, numbers being numbers, can always differ from each other; that is, it is very likely there would be a difference in the Average sales of the Test and Control groups. → This difference (“incrementality”) we observe, based on our current sample, is worth caring about if and only if we are confident that this is not trivial, not due to chance, not random. This confidence is also known as statistical significance.
‘Statistical Significance’ is needed to determine whether the observed result is a chance outcome or not. For example, if there is a $100 difference in Average sales of the Test vs. Control group; to attribute it to the campaign, we need to be sure that this is not just a ‘chance’ difference. This is where we check for its statistical significance.
Incorporating “Significance” into Hypotheses
Incorporating “significance” in our hypothesis, we have::
H0: Test_Sales = Control_Sales (Test_Sales is not significantly different from Control_Sales) H1: Test_Sales != Control_Sales (Test_Sales is significantly different from Control_Sales)
Recall: Null Hypothesis (H0) is defined as the hypothesis of no difference between the two groups → any observed difference is random or due to chance. → In other words, in this scenario H0 is the distribution of ‘chance differences’.
.. Back to the researcher’s process, let’s think through what we are doing..
- Assuming H0 is true, implies assuming that our observed ‘sample’ lies on the distribution of H0 (the distribution of ‘chance differences’).
2. Examine the sample data (‘observed differences’) and see if we have evidence to reject our assumption or not.
.. We do this by finding out:: The likelihood (probability) of getting the ‘observed differences’ given that H0 is true (i.e., ‘sample’ lying on H0).
Notice that :
- If this probability is LOW → we have evidence (in the form of our current ‘sample’) that our initial assumption was wrong → Reject H0.
- If this probability is HIGH → we have no evidence that our assumption was wrong → we cannot reject H0.
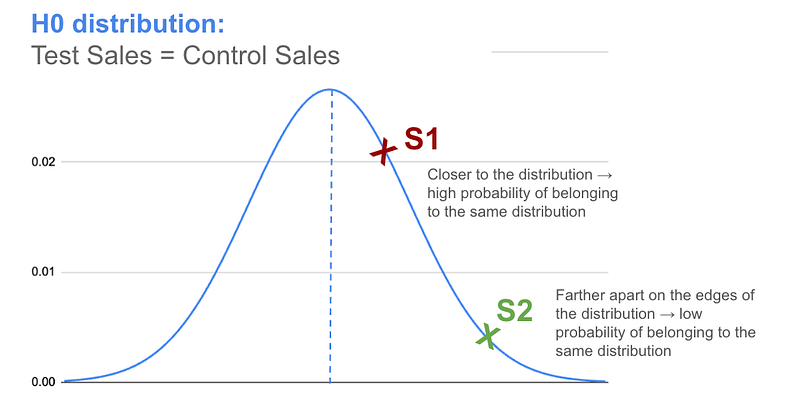
For example, below in figure-1, we have the distribution of H0 and we assume that our sample must lie on it. We just want to examine the probability of getting our “observed sample result” on H0..
- If our observed sample result is ‘S1’: We notice that it lies close to the center of distribution (where the bulk of samples from H0 would lie) and it is a highly probable result of H0 being true. It does not provide any evidence that it is not from H0.
- If our observed sample result is ‘S2’: We notice that as it lies close to the edges of distribution (where a very small number of samples from H0 would lie), it has a low probability of coming from H0. That is, it can serve as evidence that it is not from H0 and may have come from a different distribution.
Essentially, we need to determine the probability of seeing the observed sample’s result (S) under our assumption of the H0 distribution being true (that is, under the assumption “S” lies on H0). .. This probability is also known as the P-value…
P-Value.
The p-value is the probability of obtaining a result by chance or randomly.
..In other words, the P-value is the probability of observing the sample result (“S” ) assuming H0 is true (i.e., assuming “S” lies on H0).
… Notice, that the P-Value Lets think this through
- High P-Value: High probability of getting the obtained results due to chance (under our assumption of a true H0) → Our “observed sample result” provides no evidence that the observed “sample” does not come from H0. → H0 cannot be rejected
- Low P-Value: Low probability of getting the obtained results due to chance (under our assumption of a true H0) → Our “observed sample result” provides evidence that the observed “sample” does not come from H0. → H0 can be rejected
Low P-value → Observed results are Significant→ High confidence in rejecting H0
The p-value is the probability of obtaining a result at least as extreme as the one observed, assuming that the null hypothesis (H0) is true.
To learn more about p-values, please refer to:
.. To assess if the P-Value is High/Low we need to compare it to something. → We compare it to a predetermined ‘benchmark’ — this is called the ‘significance level’ of the study and is represented by Alpha.
Significance level (Alpha).
The pre-decided ‘benchmark’ probability; beyond which we are happy to consider the observed results to be “not due to chance” under our assumption of a true H0; is known as the level of Significance (represented by, Alpha) of the study.
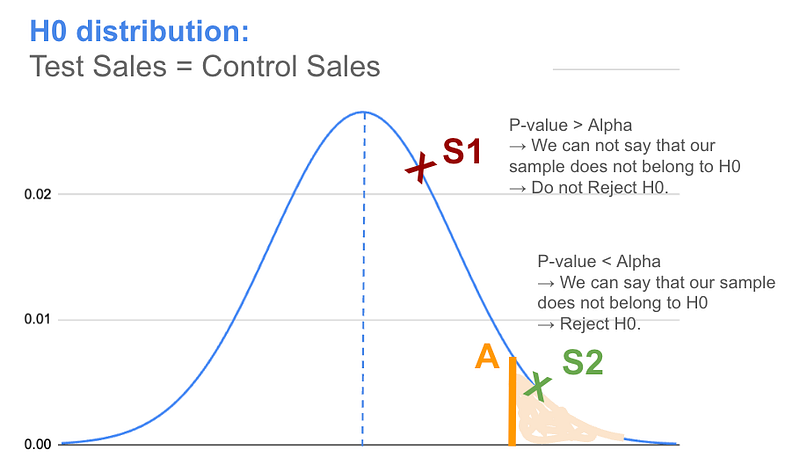
For instance, consider figure-2 below: if we select 5% as the level of significance and “A” represents the “value” on H0 corresponding to this.
- When P-value > Alpha → Our “observed sample result” lies on the region left of A (the un-shaded region); for example “S1”, we say that based on our pre-decided level of significance, we do not have evidence to say with certainty that “S1” does not belong to H0. → We do not reject H0.
- When P-value ≤ Alpha → Our “observed sample result” lies on the region right of A (the shaded region); for example “S2”, we say that based on our pre-decided level of significance, we have evidence that “S2" does not belong to H0. → We Reject H0.
‘Alpha’ represents the pre-selected probability cap; below which we consider the observed results of our study to be non-random, not due to chance; .. in other words “significant” … and we reject a Null Hypothesis (H0) accordingly.
P-Value ≤ Alpha-value → Reject H0 P-Value > Alpha-value → Do not Reject H0
*Alpha-values of 1%, 5% and 10% are used commonly in experiments; with 5% being the most widely used value.
- P-value < 5% → a <5% chance that the observed difference is by chance alone. - P-value < 1% is considered to be more significant → a 1% chance that the observed difference could have occurred by chance alone.
In cases where H0 is actually true; however, we observe p-value ≤ Alpha → we would wrongly conclude to Reject H0 (as it was actually true) → If we were to repeat the experiment infinite times, ‘Alpha’% of those would end in us falsely rejecting a true H0.
In a hypothesis test, the significance level of a study is the pre-selected threshold probability value that defines the maximum acceptable probability of rejecting a true Null hypothesis.
Notice that, wrongly rejecting a true H0 (also called a Type-I error) is just one type of error; there can be another type as well; that is, accepting an untrue H0 (also called Type-II error). (..more on this in the next article).
Statistical Significance.
The ‘observed results’ of a study are said to be statistically significant if, upon analysis, we conclude that there is evidence that the “observed outcomes” are not simply due to chance.
.. In other words, the “difference” between Test and Control sales is said to be statistically significant if we conclude that this is not due to chance.
As discussed, this is done by comparing (1) and (2): (1) Our pre-set level of significance (that is, Alpha Value); with, (2) The calculated probability of seeing “observed differences” under a true H0 assumption(that is, P-value).
For example: If we set our level of significance (Alpha) at 5% and we observe a $100 difference in ‘sales per person’ of the Test group and the Control group and the corresponding P-Value is 4%
As P-Value < Alpha → we can reject H0 of no difference and conclude that: → Marketing intervention caused people to spend $100 more, and the result is statistically significant.
Notes
- It is important to note that statistical significance does not necessarily mean that the observed difference is important or meaningful. In our example, we might see that the marketing campaign drove a difference of $10K in iPhone sales (which might be statistically significant); however, if the marketing activity cost $100K — this $10K is not meaningful.
- It is also important to note that statistical significance can be misleading if the study design is flawed. Remember, the underlying assumption of the Test and Control groups being similar in all aspects and no factor, other than the campaign, influencing either of them during our study.
Summary
Statistical significance is a concept, widely used by researchers to make meaningful conclusions about their data. It is used to determine whether observed results in a study are likely due to a real effect rather than random chance.
This is done by assuming the Null Hypothesis (H0) [of “no difference”] to be true and comparing the pre-determined level of significance of the study with the observed P-value of the sample.
- The P-value quantifies the probability of obtaining results as extreme as or more extreme than the observed results, assuming the null hypothesis is true.
- The level of significance of a study (represented by the Alpha-value) is the predetermined threshold with which, upon comparing the observed P-value, we reject or not reject the Null Hypothesis (H0). - 5% is the most commonly used level of significance for statistical analysis.
For our “marketing intervention” example:
H0: Test_Sales = Control_Sales (Test_Sales is not significantly different from Control_Sales) H1: Test_Sales != Control_Sales (Test_Sales is significantly different from Control_Sales)
We calculate the corresponding P-value to our observed result, and:
Case: P-Value > Alpha-value → Do not Reject H0 Conclude: Test_Sales is NOT significantly different from Control_Sales
Case: P-Value ≤ Alpha-value → Reject H0 Conclude: Test_Sales is significantly different from Control_Sales
- Statistical significance does not necessarily indicate the practical importance or meaningfulness of an observed difference.
- Statistical significance can be misleading if the study design is flawed or if groups are not similar at the outset.
- Researchers should consider both statistical significance and effect size when drawing conclusions. (..more on this in a future article)
Appendix 1.1 https://trends.google.com/trends/explore?date=today%205-y&q=marketing%20impact&hl=en
Connect, Learn & Grow ..
If you like this article and are interested in similar ones follow me on Medium, LinkedIn, connect with me 1:1, join my email list and (..if you already are not..) hop on to become a member of the Medium family to get access to thousands of helpful articles. (I will get ~50% of your membership fees if you use the above link)
.. Keep learning and keep growing!


