
Decoding Financial Narratives with Python: The Mann-Kendall Insight
Demystifying Trends in Time Series Data for the Astute Financial Enthusiast

In the intricate ballet of finance, where numbers pirouette and intertwine in an endless dance, the ability to discern trends becomes a crucial asset. We might find ourselves surrounded by a haze of data points — daily stock prices, quarterly returns, or monthly sales figures — but what do these numbers truly reveal about the direction we’re headed in? Enter the Mann-Kendall Trend Test. This non-parametric test allows us to decipher whether there’s a significant trend within a time series dataset.
Engage with Me!
Before we dive deeper, if you find any value or resonance in this piece, please hit that clap button or drop a comment. It’s tough gauging feedback with Medium’s current setup, and your engagement genuinely helps me understand what strikes a chord with you!
Why Mann-Kendall?
Non-Parametric Nature
- Understanding Non-Parametric: In statistics, a non-parametric model is one that does not assume a specific form or structure for the underlying data distribution. In real-world scenarios, especially in finance, data can often behave in unexpected manners, failing to adhere to popular distributions like the normal distribution.
- Why It Matters: Financial data is notoriously unpredictable. Stock prices can swing due to countless factors ranging from geopolitical events to tweets from influential figures. The non-parametric nature of the Mann-Kendall test means we’re not making rigid assumptions about the data distribution, which makes our trend analysis more robust and adaptable.
Robustness Against Missing Data
- Incomplete Datasets: In financial studies, data might be missing due to public holidays, technical glitches, or delays in data reporting. This could skew the results in tests that are sensitive to missing data points.
- Mann-Kendall’s Edge: The test doesn’t get easily derailed by these gaps. While it’s always ideal to have a complete dataset, the Mann-Kendall test’s resilience makes it a reliable tool even when data is imperfect.
Generality & Flexibility
- Different Datasets: Whether you’re looking at a decade’s worth of annual GDP data or a month’s worth of intra-day stock prices, the Mann-Kendall test remains applicable. Its flexibility is a boon when analysts are confronted with datasets of varying sizes and granularities.
- Not Restricted to Linearity: Some statistical tests are best suited for linear trends. However, financial trends can be non-linear, following more complex trajectories. The Mann-Kendall test doesn’t pigeonhole trends into strictly linear or non-linear categories, making it adept at handling the eccentricities of financial data.
Intuitive Interpretation
- Understandable Output: The test generates a tau value and a p-value. Tau tells you the direction and strength of the trend, while the p-value speaks to its statistical significance. In the fast-paced realm of finance, where decisions often need to be made quickly, the clarity of this output can be invaluable.
- No Need for Data Transformation: Some statistical tests require the data to be transformed or adjusted to meet underlying assumptions. With Mann-Kendall, you can often work with the raw data, simplifying the analytical process.
Applying the Mann-Kendall Trend Test to Financial Data using Python
Fetching Stock Data Using yfinance
First, we need to install and import the necessary libraries:
!pip install yfinance

import yfinance as yf
import numpy as np
import matplotlib.pyplot as plt

# Fetching the daily closing prices for Apple (AAPL) for the last 5 years
ticker = "NVDA"
stock_data = yf.download(ticker, start="2018-01-01", end="2023-01-01")
closing_prices = stock_data['Close'].values
Applying the Mann-Kendall Test
Now that we have our data, we can apply the test:
from scipy.stats import kendalltau

# Applying the Mann-Kendall Test
tau, p_value = kendalltau(np.arange(len(closing_prices)), closing_prices)

print(f"Tau: {tau}")
print(f"P-Value: {p_value}")
The quick interpretation guide:
- A positive tau indicates an increasing trend.
- A negative tau indicates a decreasing trend.
- A small P-value (typically ≤ 0.05) indicates the trend is statistically significant.
Tau (τ) = 0.6094
The Tau value is positive and fairly close to 1, indicating a strong increasing trend in the daily closing prices of the stock. In simpler terms, over the observed period, the stock’s closing price has largely been on an upward trajectory.
P-Value = 4.2514e-230
This is an extremely small number, essentially very close to zero. The P-value tests the null hypothesis that there is no trend. In the context of the Mann-Kendall test, a P-value less than a chosen significance level (e.g., 0.05 or 5%) would lead us to reject the null hypothesis. Given that this P-value is significantly smaller than 0.05, we can conclude that the observed trend (in this case, an increasing trend indicated by the positive Tau value) is statistically significant.
Visualizing the Stock Data and Results
Visual representation helps in a more intuitive understanding:
# Plotting the daily closing prices
plt.figure(figsize=(10, 6))
plt.plot(stock_data.index, closing_prices, label=f"Closing Prices of {ticker}")
plt.xlabel('Date')
plt.ylabel('Price (in $)')
plt.title(f'Daily Closing Prices of {ticker} Over 5 Years')
plt.legend()
plt.grid(True)
plt.tight_layout()
plt.show()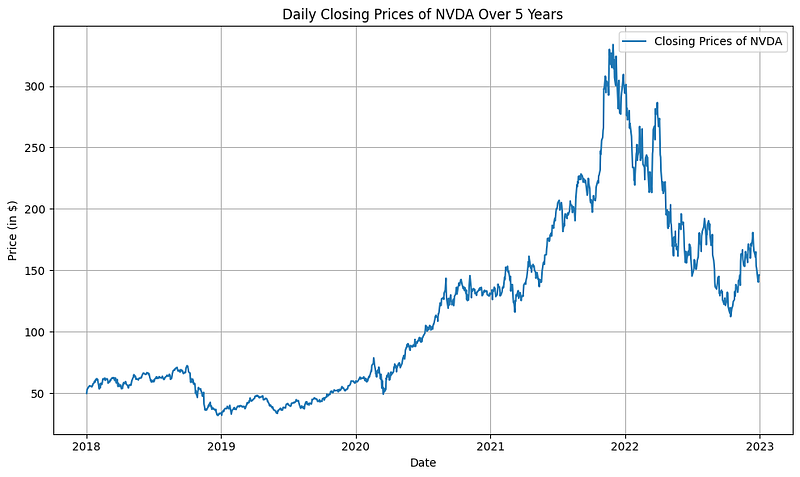
Wrapping Up
Applying the Mann-Kendall test to financial data like stock prices provides a robust method to detect trends without assuming any particular data distribution. This is especially handy in the world of finance, where data can often exhibit non-normal behaviors.
However, always remember that while statistical tests can point to the existence of a trend, they don’t provide context. Factors external to the data, such as market news, global events, or changes in company management, can also significantly influence stock trends. It’s always essential to blend quantitative analysis with a qualitative understanding of the broader picture.


