
Experiment Analysis
Decoding Data Success: A Comprehensive Guide to A/B Testing Analysis [Part 1]
Master A/B testing analysis for decisive, data-driven actions and maximize business success.
In today’s data-driven world, businesses have access to abundant information. A/B testing, also known as split testing, is a powerful technique that allows companies to harness this data to make informed decisions and optimize various aspects of their operations. Whether it’s tweaking a website’s design, refining a marketing campaign, or enhancing a product’s user experience, A/B testing is a valuable tool that can significantly impact a company’s success.
The series, spanning three blogs, initiates a comprehensive analysis, delving into specific steps to illuminate the path toward data-driven success — Part 1 sets the stage, while subsequent details unfold in Part 2 and Part 3.

What is A/B Testing?
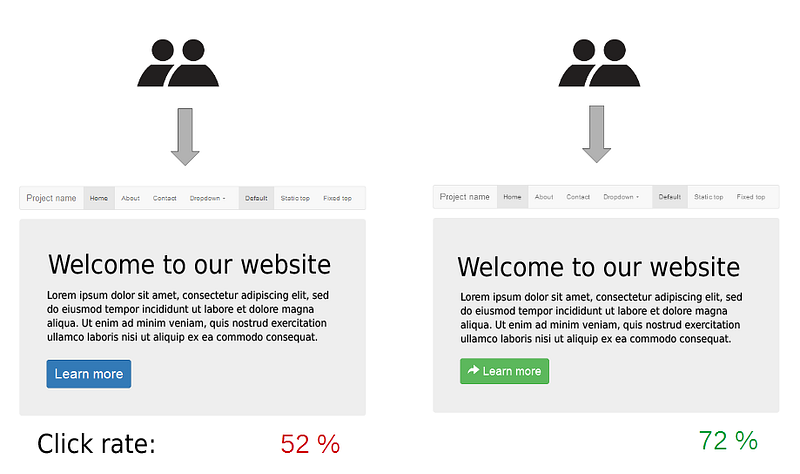
A/B testing is a controlled experimentation method used to determine which version of a webpage, marketing material, or product feature performs better in terms of a specific goal. It involves dividing a target audience into two or more groups and showing each group a different variant (A and B, for example) to compare their performance. The goal is to identify which variant is more effective and to optimize the element being tested based on the results.
How to Perform Analysis of A/B Experiment
In the analysis framework of a generic A/B experiment, we systematically engage in multiple stages to ensure the reliability and validity of results. These include —
- Initiating Sanity Checks to validate data integrity
- Implementing Variance Reduction techniques, specifically employing CUPED methodology
- Conducting rigorous Statistical Tests for significance
- Finally, undertaking Post-Test Computations. The latter involves computing essential metrics such as Lift, Sample Size, and Confidence Intervals, all of which collectively contribute to a thorough understanding of the experimental outcomes.
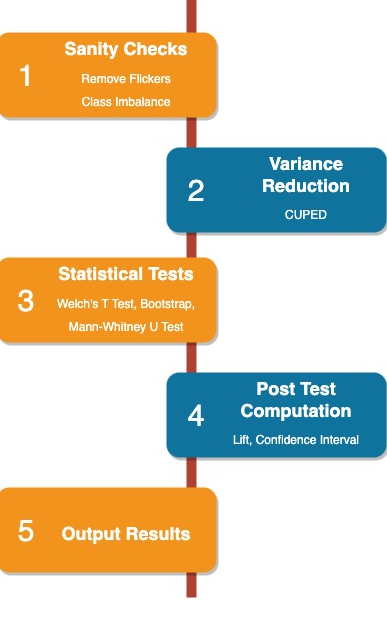
The subsequent sections will provide a detailed exploration of each of these pivotal steps in the Experiment Analysis Flow.
Sanity Checks
Sample Ratio Mismatch (SRM) Test
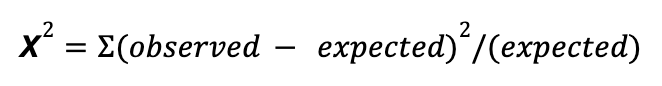
A Sample Ratio Mismatch test is performed to check if the traffic is being split as per the weights assigned in the experiment configuration.
Chi-square statistics can be used to check if the likelihood of the difference between the ratios is outside of normal chance. We can generate an SRM alert when the p-value of the test falls below the threshold of 0.01.
Flickers
Flickers are respondents who have switched between control and treatment groups. For instance, an application user may have an older version of the OS and choose to upgrade it while the experiment is running, leading them to experience both the control and treatment effects. Such a user constitutes a flicker in the experiment. Ideally, there should be no flickers in an experiment but depending on the configuration, we may get them. We should remove flickers before running the analysis and can also report the percentage of flickers in the experiment
Bias Detection
To check if there is any bias between sampled variants, we can apply bias detection which evaluates the goal metric on pre-experiment data using the K Sample Anderson-Darling Test
K-sample Anderson–Darling test is available for testing whether several collections of observations can be modeled as coming from a single population, where the distribution function does not have to be specified.
For k samples, the statistic can be computed as follows under the assumption that the distribution function Fᵢ of ith sample is continuous.
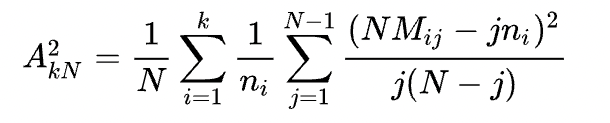
where
- nᵢ is the number of observations in the ith sample
- N is the total number of observations in all samples
- Zᵢ is the pooled ordered sample
- Mᵢⱼ is the number of observations in the ith sample that are not greater than Zᵢ
If bias exists, we can run a difference-in-difference method, strategized sampling, or propensity matching on the data to get reliable results.
To read more about the Difference-in-difference method please refer to the next blog of the series.
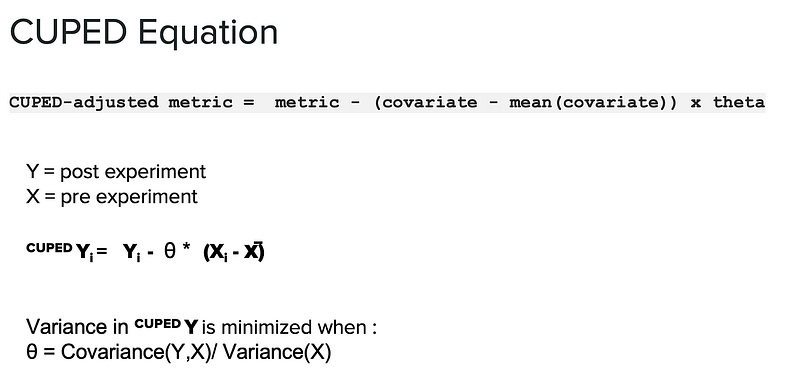
Variance Reduction using CUPED
CUPED, or Control using Pre-Experiment Data, represents an innovative approach designed to enhance the robustness of experimental analyses. The method strategically incorporates pre-experiment data to effectively control for the inherent variations observed in the metric under investigation during an experiment. This pre-emptive adjustment serves the crucial purpose of eliminating or reducing the impact of natural fluctuations, thereby providing a more stable foundation for statistical analyses.
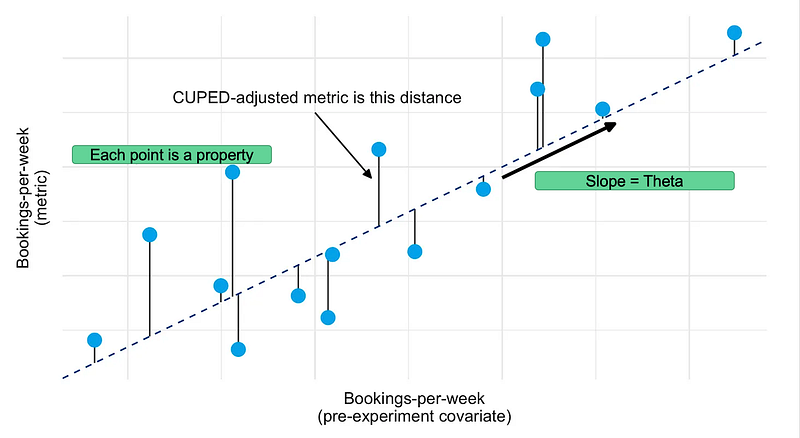
The primary advantage of employing CUPED lies in its ability to facilitate statistical tests with a diminished sample size requirement. By reducing the influence of natural variation, researchers can achieve greater precision in their analyses, leading to more reliable and conclusive results. This reduction in sample size not only streamlines the experimental process but also contributes to resource efficiency, making experiments more cost-effective and manageable.
Furthermore, the versatility of CUPED is a noteworthy feature, as it seamlessly integrates into a diverse array of A/B testing frameworks. Its computational efficiency ensures that the method does not impose a significant computational burden, making it a practical and accessible tool for researchers and data scientists. Moreover, the straightforward coding implementation of CUPED simplifies its adoption, allowing researchers to easily incorporate this technique into their experimental designs.
To continue exploring the successive components of this series, please refer to Part 2 of the blog.
References:
- https://en.wikipedia.org/wiki/A/B_testing
- https://www.scribbr.com/methodology/controlled-experiment/
- https://www.bmj.com/about-bmj/resources-readers/publications/statistics-square-one/8-chi-squared-tests
- https://www.itl.nist.gov/div898/software/dataplot/refman1/auxillar/andeksam.htm
- https://booking.ai/how-booking-com-increases-the-power-of-online-experiments-with-cuped-995d186fff1d
If you have read so far, a big thank you for reading! I hope you find this article to be helpful. If you’d like, add me on LinkedIn!
Good luck this week, Pratyush