
Dealing with Node.js high CPU in production
Let’s assume you have a Node.js service deployed in production, every line of code is reviewed and covered with tests. But with 10 requests per second, the Node.js process begins to consume 100% CPU, or there are some random spikes on a CPU graph, as a result, response time grows and affects all consumers. For sure you can just increase the amount of the running instances, but it’s not a resolution of the problem, the service will behave the same.

High CPU root causes
- Loops and iterations. Any
.map,.reduce,.forEachand other iteration methods call can cause a problem if you don’t limit the size of the iterable collection. The same potential issue withforandwhileloops. If you have to deal with big collections, use streams or split collections into chunks and process them asynchronously. It will distribute the load between different EventLoop iterations, and the blocking effect will be reduced. - Recursive functions. The same principle here, you need to take about recursion depth, especially when the function is synchronous. Example from my experience: one of my teammates added a function for solving the Trading Salesman Problem, it had worked fine until it was called with 28 points. As a result, each call blocked the whole Node.js process for 2 seconds with 100% CPU.
- Huge payloads. Node.js is created for dealing with a massive amount of asynchronous operations like making requests to databases or external API calls. And it works perfectly until payloads from external sources are small. Don’t forget that Node.js needs to read a payload and store it in memory first, then parse JSON into an object (more memory added), perform some operations with the object. Huge payloads from Node.js services also can be a problem, because Node.js stringifies objects to JSON first and then sends them to the client. All of these operations can cause high CPU, make sure that payload size is not huge, use pagination, and don’t prepopulate unnecessary data. For GraphQL services use complexity to limit the response payload.
Promise.all. Don’t get me wrong,Promise.allis OK itself. But it might cause problems if you call it with a big amount of operations. For example, you have an array of id-s and you need to read entities from the database. If there are 10 id-s in the list, it’s not an issue, but if there are 1000… Try to bulk operations like this, and read data from the database with a cursor.- Memory leaks. Node.js has a built-in Garbage Collector, depending on different conditions Garbage Collector removes unused objects from memory. Searching and removing unnecessary objects is a not cheap operation. And if there is a memory leak in your Node.js service, Garbage Collector will try to free memory over and over again without any success, just wasting CPU.
So, how to find a high CPU root cause?

The obvious decision is trying to reproduce the issue locally. Try to run your service locally, and make some requests to it. You can create load testing scripts on Node.js, or use load-testing frameworks like Artillery. Just remember local configuration should be as close to production as possible. Open resource monitor, run load tests and watch. If you succeed with reproducing, restart your app with --inspect flag, execute load tests again, open chrome://inspect in Chrome browser:
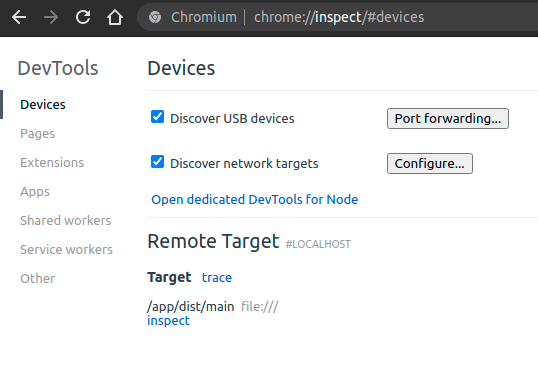
Click inspect bellow your app, and then start CPU profiling:
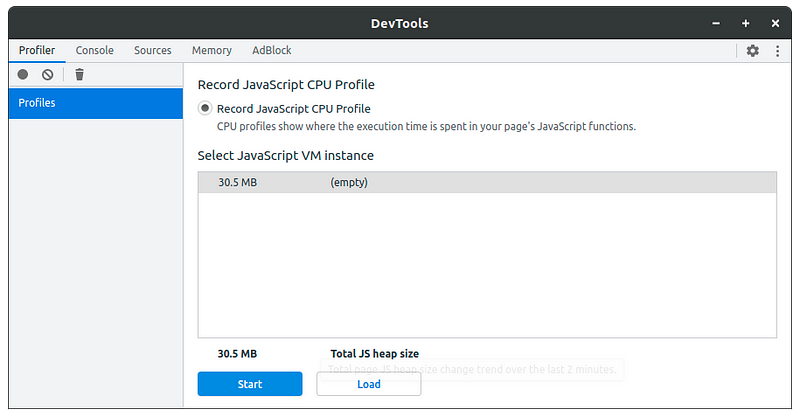
Wait for some time, mostly 10–15 seconds is enough, and you got CPU profile:
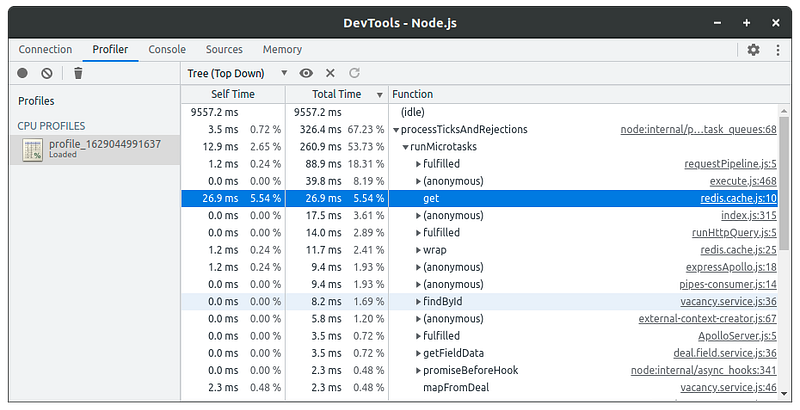
And now you can detect what’s wrong with your code, CPU profile has everything you need for that.
Also, it can be useful to take a heap profile to detect if there is a memory leak. Just click the Memory tab and click Take snapshot:
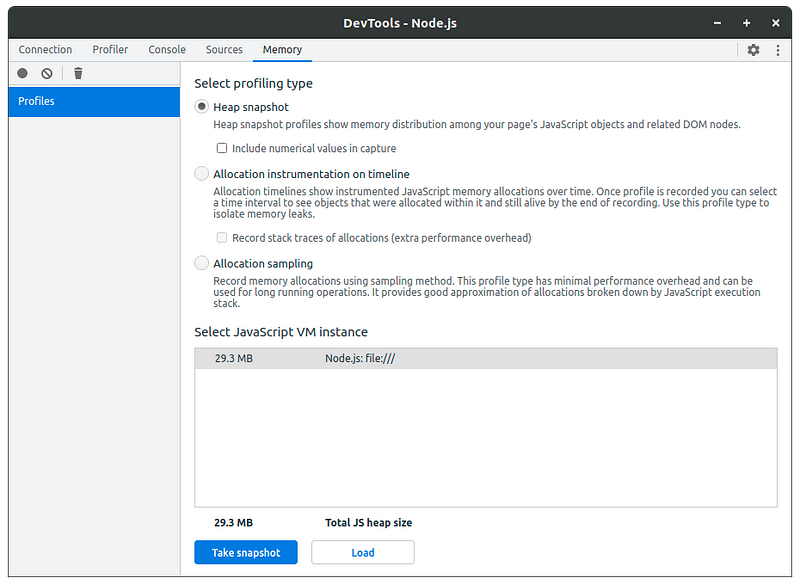
As a result, you’ll something like this:
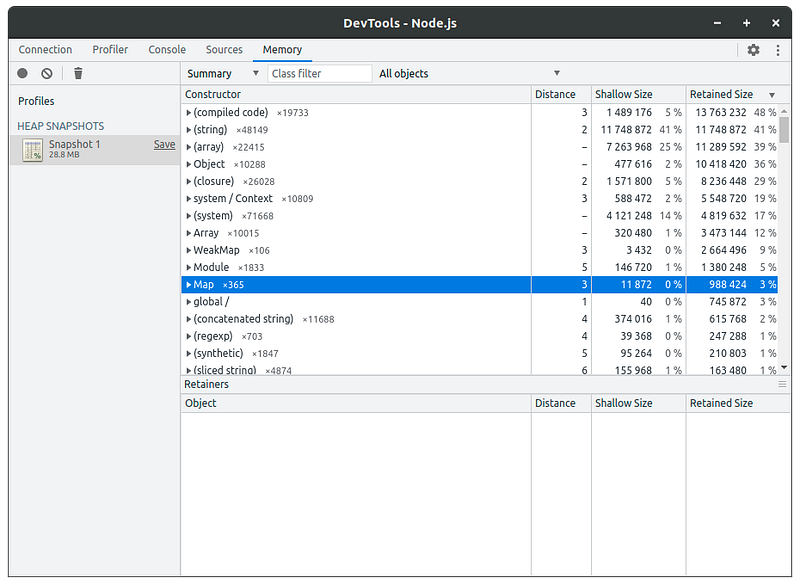
Ignore rows with system types (compiled code), (string), (array), Object, (closure), system / Context, (system), Array, WeakMap etc., most time they won’t help to detect memory in your code. Try to make several Heap Snapshots to see how objects amount of each type is changed. If it only grows, I bet you have a memory leak :)
What about production? How to take CPU profile on running instance?

In most cases, it’s very difficult to reproduce performance issues, because you need the same environment configuration, the same data in databases, caches, and so on. A performance issue can be specific only for some categories of users because they have specific data.
What about debug mode in production? Well, it’s not recommended to enable debug mode on production, because in debug mode Node.js processes consume more resources, and it’s not safe.
But there is a better approach, take profiles on-demand with inspector module https://nodejs.org/api/inspector.html. It’s a Node.js built-in module, you don’t have to install any additional dependencies, but I recommend you to use inspector-api https://www.npmjs.com/package/inspector-api. It’s a simple wrapper with promises support. Let’s create an endpoint that records a CPU profile, I’ll create an example for NestJS, for other frameworks it looks pretty the same:
Please don’t forget to secure this endpoint, it must be accessible only for super admins or system users. Let’s test it with curl:
curl -X POST http://127.0.0.1/profile/cpuAnd after 5 seconds we got a profile in the response. You can save it and check with Chrome Developer Tools.
Let’s add a similar endpoint for taking heap snapshots:
Now you can take CPU and heap snapshots whenever you want, just copy them locally after recording. You can checkout this example source code from here https://github.com/lucky-libor/inspector-api-example.
Conclusion
Today we’ve discussed what can cause performance issues in Node.js applications, and how to find issues locally and in a running production environment without restarting. IMHO performance fixes and optimization is the most interesting part in developer work. If you have proper tools, it’s not so hard to find and fix any issue.
See you next time! Servus!


