
DCF analysis by examples based on semiconductor and tech biz (2023)
Importance of DCF analysis

Warren Buffett (at Terry College of Bussiness University) got his to say about Discounted Cash Flow analysis.
Intrinsic value in a company, intrinsic value is what is the number that if you were all-knowing about the future and could predict all the cash that the business would give you between now and judgment day discounted at the proper discount rate that number is what the intrinsic value of businesses. In other words, the only reason for making investments and laying out money now is to get more money later on right that’s what investing is all about now.
When you look at a stock when you look at a bond so means united states government very easy to tells you what you’re going to get back on the bond, when you get the interest payments, says when you get the principal so it’s very easy to figure out the value of a bond. It can change tomorrow if interest rates change so the cash flows are printed on the bond. The cash flows aren’t printed on a stock certificate that’s the job of the analyst is to print out changes to that stock certificate which represents an interest in the business and change that into a bond and say this is what I think it’s going to pay out in the future.
When we buy you know some new machine for Shaw to make carpet that’s what we’re thinking about obviously and you all learn that in business school but it’s the same thing for a big business. If you buy Coca-Cola today the company is selling for about 110 to 115 billion dollars in the market the question is if you had 110 or 115 billion you wouldn’t be listening to me but I’d be listening to you instantly. The question is would you lay it out today to get what the Coca-Cola company is going to deliver to you over the next two or three hundred years, the discount rate doesn’t make much difference after as you get further out but that is the question is how much cash they’re going to give you this.
Isn’t a question of you know, isn’t the question about how many analysts are going to recommend it or what the volume in the stock is or what the chart looks like or anything like. It’s a question of how much cash it’s going to get you that’s the only reason it’s a true one. If you’re buying a farm it’s true if you’re buying an apartment house any financial asset oil in the ground you’re laying out cash now to get more cash back later on and the question is is how much you’re going to get. When are you going to get it and how sure are you when I calculate the intrinsic value of a business when we buy businesses and whether we’re buying all of a business or a little piece of a business. I always think we’re buying the whole business because that’s my approach to it I look at it and say what what will come out of this business and when and what you really like of course is them to be able to use the money they earn and earn higher returns on it as you go along.
I mean Berkshire has never distributed anything to its shareholders but its ability to distribute goes up as the value of the businesses we own, increases. We can compound it internally but the real question is Berkshire selling for we’ll say 105 or so billion now. Uh, what can we distribute from that hundred if you’re gonna buy the whole company for 105 billion now can we distribute enough cash to you soon enough to make it sensible at present interest rates to lay out that cash now and that’s what it gets down to it if you can’t answer that question you can’t buy.
In accounting, free cash flow is considered a direct method, it is the direct method of cash payments and receipts reflecting the beginning and ending balances of funds a business can liquidate quickly while the indirect method adjusts net income with changes applied from non-cash transactions, see the link.
We should view this article from a data science perspective, basic/regular math, or accounting based on historical data based on free cash flow rather than buy/sell trading recommendations. If you are interested in Berkshire’s Warren Buffett holding of Apple, the Company has been purchasing Apple since 2016.
Berkshire spent about $36 billion between 2016 and 2018 to amass a 5.4% stake in Apple. It cashed out around 9% of the position in 2020, lowering its cost base to $31 billion. It has only tweaked the holding since then, meaning it’s made roughly five times its money on paper.
Warren Buffett defended the size of Berkshire Hathaway’s $158 billion stake in Apple on Saturday. [1]
My DCF setup
I decided to use historical data from the past 10 years, which are widely available to investors, as my What-if analysis, Excel defined this as how those changes may affect the outcome, projecting from the historical past toward the current year analysis as if rewinding the time series as if there was a Time Machine and checking whether it is still making sense. Apart from these, the listing of current price quotes was pulled out from current market pricing … perhaps we can spot any potential gap.
In my case, I obtained these data available at the TIKR terminal (or my source code at the Github link). Future cash flow projections for stock equity can be quite uncertain, depending on analyst projections, at the turn of the event especially during the unusual period in the mid of 2022 when the FED raised their interest rate to dampen interest rate hike in response to the incessant surge of inflation peaked up to 9.1% in 2022. The recession outlook in 2023 is forecasted to reduce companies’ employee spending, cuts, and reduction of capital spending to tame inflation.
Underlining my projection, the WACC is an important metric that reflects the cost of capital for a company and helps in determining the feasibility of a project or investment. It is important to estimate the WACC based on realistic assumptions about the cost of capital and the level of risk the company faces.
For my DCF I decided to fix my WACC (or the Whack factor, Weighted Average Cost of Capital) and growth rate (Target Growth Rate) to 10% and 2.5% respectively as my long-term measures. Some bloggers preferred WACC to be between 9% to 12%. A higher rate of WACC implies a higher required rate of return (RRR) demanded by equity owners hence reducing the number of stock equity available, among the universe of equity, which may compel investors to the Company. On the contrary, a lower WACC rate implies a lower RRR and larger opportunities that can attract investors.
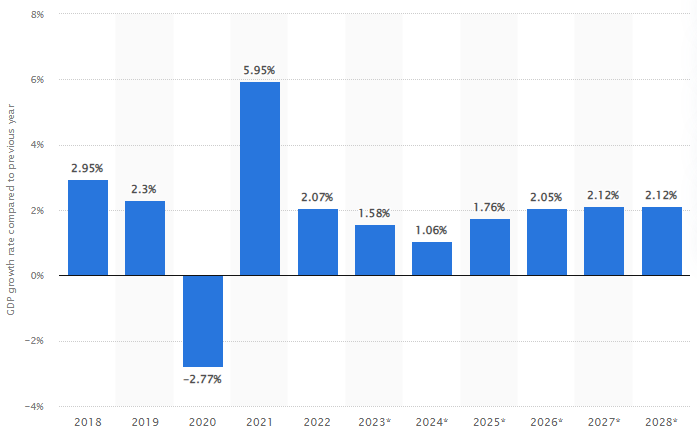
The growth rate of a company and the growth rate of the economy, as measured by the Gross Domestic Product (GDP), can have an impact on the company’s WACC. The growth rate of the economy, as measured by the Gross Domestic Product (GDP), can have an impact on the company’s WACC. Growth rate can be related to the equation of terminal discount rate as the reciprocal of WACC and growth rate via 1/(WACC — Growth rate) implying a growing economy and cheaper equities in stock seen in 2021 priming by COVID-19 stimulus and relief monetary injection in 2020, until the crash in 2022.
If you enjoy reading my article, please help to subscribe to my blog post to reach my 100 followers target. Thx!!
Free cash flow
Free cash flow per share/unit can be computed by OCF (Operating Cash Flow) minus Capex divided by the available stock investors (Weighted Average Diluted Shares Outstanding) normalized to the effect of dilution of equity. This measure signals a company’s ability to pay debt, pay dividends, buy back stock, and facilitate the growth of the business. Also, the free cash flow per share can give a preliminary prediction concerning future share prices. What happens when free cash flow goes down to negative? I wrote a short article here.
DCF analysis helps to determine the viability of an investment based on its future cash flows. The present value of expected future cash flows is arrived at using a projected discount rate, discounting future cash flow to the present value. If the DCF is higher than the current cost of the investment, the opportunity could result in positive returns and may be a worthwhile investment. The disadvantage of DCF is its reliance on estimations of future cash flows, which could prove inaccurate. To supplant this shortcoming, I used the past 10 years of data in the preceding section.
The terminal value (TV) of the free cash flow of the last period, can be computed as follow: -
tv = fcf * (1 + tgr) / (wacc - tgr)Similarly, the discount rate at the last period was the reciprocal of the divisor of WACC power at the number of the last period. Discounting the terminal value will yield the present value of the terminal value. Summing the present values obtained from our FCF analysis plus the present terminal value (sum of PVTV), putting it all together, it is the value of the Company available to the equity.
dr = 1 / (1 + wacc) ** nper
pvtv = dr * tv
sum_pvtv = sum(pv) + pvtv
Warren said the cash flows aren’t printed on a stock quotation, ticking up and down, rather it is the job of the analysts to determine if the Company is worthy of the investment.
My listing
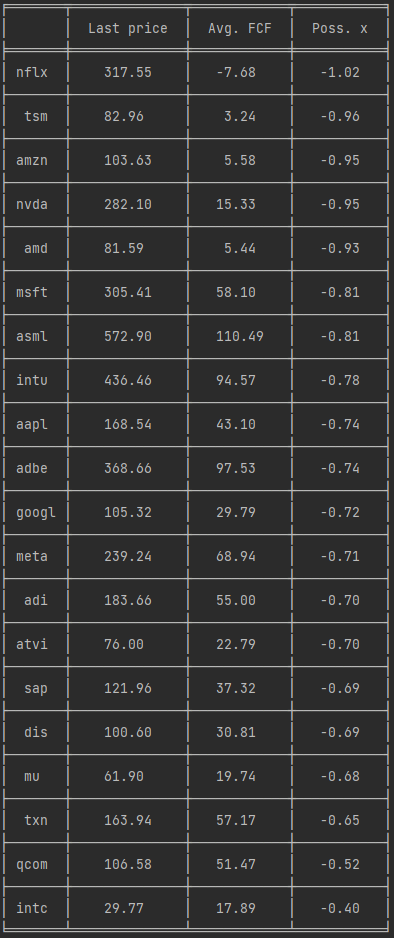
I took a handful of stock quotes found in semiconductor and tech companies, listed by the last transaction price quote. The Last FCF column was derived based on FCF (free cash flow) as a summation of present values plus a terminal value (sum_pvtv in the code) as described in the latter paragraph, sorted to “likely to make it” or Possible.
poss_ratio = (sum_pvtv - last_price) / last_price
The spread was generated by the script based on a multiplier ratio from the lowest negative down to the highest positive ratio, from the least desirable to the most appealing investment.
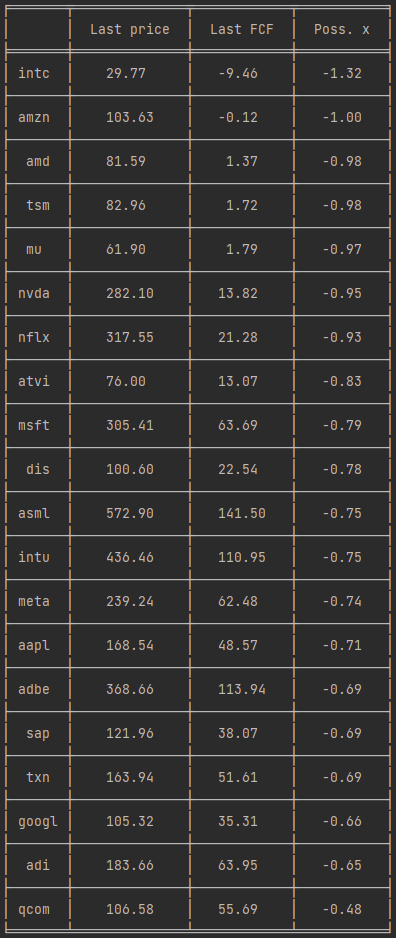
Based on the previous FCF (bottom line), none of the companies listed above are worthy of investment which was derived based on the last 10 years of data from ~2013 to the current year.
The previous decade was an unusual period with the hike towards 2021 and the sudden economic downturn in ~2022/23. I believe the U.S., semiconductor, tech biz, economist, and asset prices in general, can revert to the norm or long-term mean (average return in the last decade) despite the current downturn as listed in the chart above.
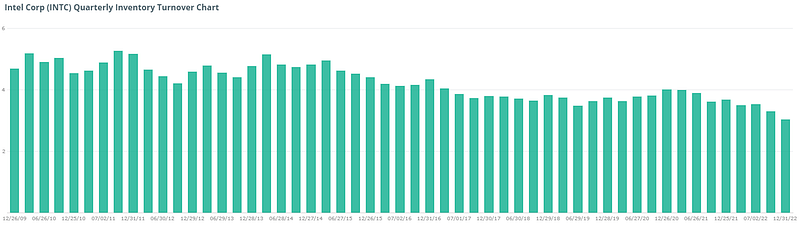
The semiconductor industry has been experiencing supply chain disruptions and shortages of key components, which have impacted production and led to an increase in semiconductor prices. With the current economic downturn, inventory correction refers to a situation where a company adjusts its inventory levels to bring them in line with expected demand. This typically involves reducing the amount of inventory on hand by selling off excess inventory or slowing down production and can occur when a company has overestimated demand or experienced a slowdown in sales.
Inventory turnover measures the rate at which inventory stock is sold, used, and replaced. A low inventory turnover ratio might be a sign of weak sales or excessive inventory, also known as overstocking. The chart below based on Intel’s inventory turnover has seen the lowest in the last decade since 2009.
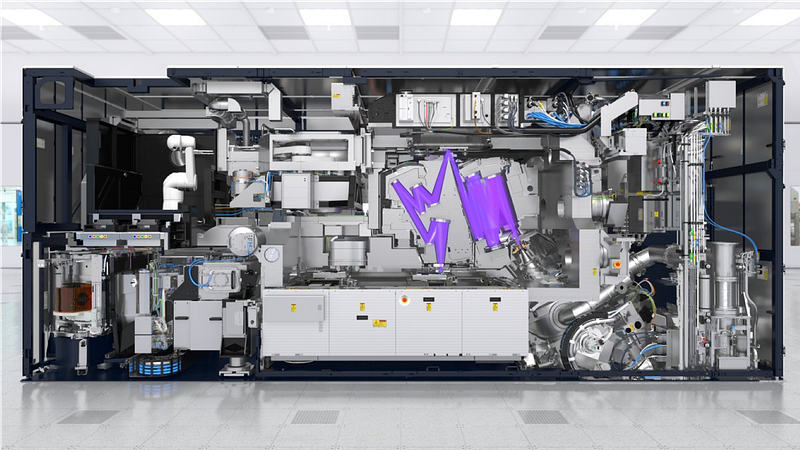
Apart, this would entail fabrication equipment, and AI computing machinery needs to be spent for their CapEx to maintain their edge in the market. Most of the build-up of CapEx at the tail end in the last 2 to 3 years ago had been quite high perhaps CEO and execs could foresee the wide availability of semiconductors and applications.
Correction
The current quarterly and last year’s results were too pessimistic. Perhaps, I can correct it by normalizing it to the last 5 years which makes more sense.
The semiconductor industry was led by explosive growth such as TSMC, NVDA (Nvidia), AMD, etc seen at the tail end of 2021 in tandem with the increased demands for gadgets, metaverse, AI, and electrical vehicles. AMZN (Amazon), which hosted online, retail stores, cloud, b2b, etc., had returned negative free cash flow in the last two years from 2021 to the current year in spite of explosive growth in revenue to date, since the last decade. Calculations based on a cash flow per share basis in the previous 10 years didn’t do justice to viewers. Buybacks of shares (repurchases) may see only a minimal uptick in buyback shares activities rather they decided to continue to invest in CapEx spending despite the current downturn.
Warren said investing is all about the future free cash flow payback to investors in return for our investments either via dividend payback or sales of the share via share capital appreciation of the values over a longer period.
Intrinsic value in a company, intrinsic value is what is the number that if you were all-knowing about the future
It is quite the polar opposite compared to the low flyer vs high flyers. Nevertheless, none of the companies in the last 5 years in the chart generated here were able to produce any positive free cash flow.
DCF based on EBITDA, CapEx, Working Cap, Tax
DCF calculation via Unlevered free cash flow is the gross free cash flow as formulated by Investopedia link: -
ufcf = EBITDA − capex +/− working_cap − taxes
Unlevered FCF can be used to compare peers companies because it represents the cash flow available to all investors, regardless of their capital structure. It provides a measure of the company’s cash-generation ability that is independent of its financing decisions and is useful for comparing companies with different capital structures, cash available to all investors not just solely to equity investors.
In contrast, my gripes about Levered FCF weaknesses are as follows instead of cash-generation ability: -
- Sensitivity to capital structure: changes in interest rates, debt levels, and the cost of capital can
- Difficult to compare across companies: Levered FCF calculations can vary significantly across different companies, making it challenging to compare performance across industries or companies with different capital structures.
Investopedia link
Even if a company’s levered free cash flow is negative, it does not necessarily indicate that the company is failing. It may be the case that the company has made substantial capital investments that have yet to start paying off.
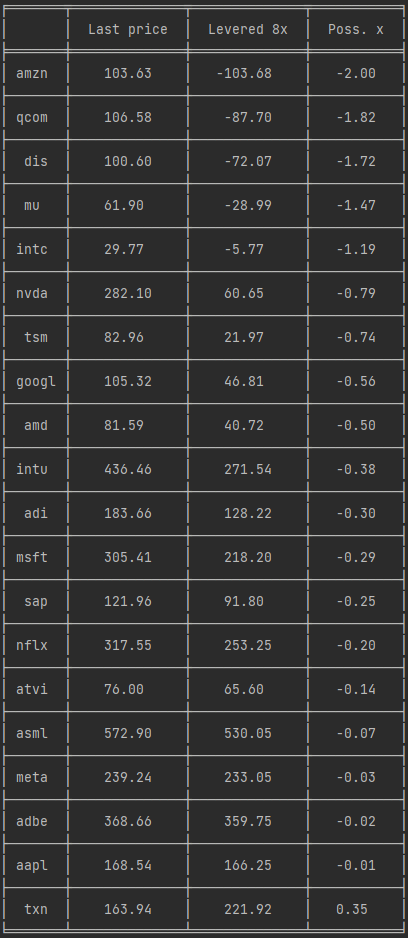
For my Levered FCF, mandatory debt payback obligations must be deducted first before being able to distribute dividends to shareholders and or share repurchases. Companies at the current to a previous year ago, some of these companies may not be able to issue share repurchases, dividends removal altogether, or dividend amounts reduction during the current recessionary period. However, I believe these companies are a temporary condition and should be able to overcome the current economic climate. Apart from these, cash-rich companies with little to no debt obligation are sorted by debt to little debt as listed in the snapshot below.
The other way to compute debt ability would be the number of years spent to pay back debt by the ratio of Net Debt against EBIT buildout or shrink, not listed yet.
net_debt_over_ebit = net_debt / EBIT # Net debt: total debt minus cashMergers and acquisitions
Mergers and acquisitions (M&A) can have a significant impact on a company’s stock price movement. M&A varies depending on several factors such as Synergies and Cost Savings, Deal Structure, Cultural Fit, Market Conditions, etc.
Investors can take advantage of price differences between the two companies or parties in such M&A deals. Arbitrageurs may seek to profit from the price differential between a target company’s stock price and the offer price made by the buyer or acquiring company.
When an acquisition is announced, the target company’s stock price typically jumps up to the offer price made by the buyer, which makes the target company more favorable to investors but it may not immediately reach the offer price. This creates an opportunity for arbitrageurs to buy the target company’s shares at a lower price and profit from the price difference when the acquisition is completed. Arbitrageurs may also take advantage of the price differential, the spread between the stock prices offered by the buyer to the target company. M&A can provide liquidity to the market to reflect the true value of the target company.
Historical recent M&A activities involved in tech and semiconductors were Xilinx and AMD, Elon Musk and Twitter for a list of successful deals and Nvidia and ARM deals failed. Activision and Microsoft deals were possibly blocked by CMA (UK’s Competition and Markets Authority) at the time of this writing.
Value at a reasonable price
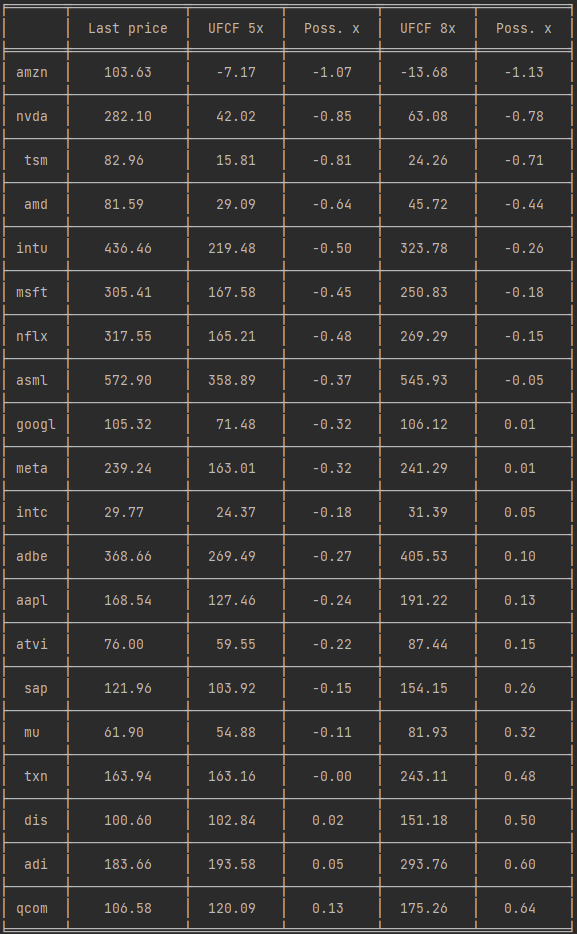
For my DCF (other alternative approaches), I decided to use multiple Unlevered FCF of 5x and 8x in my calculation, at the current market valuation (2023), at the current pessimistic outlook, to a more reasonable outlook which might occur end of ~2025/26. I decided not to factor in debts including mandatory debt obligation for Levered FCF which may reduce DCF calculation for many semiconductor companies leading to a pessimistic calculation. I don’t think is a fair valuation. I believe many companies can grow back to a moderate level at ~2025/26.
The longer-term past projection may reveal to us the current and near-forward projections of where the market may be willing to pay at some valuation approximating the price of M&A deals from cheaper to expensive/premium valuation in my calculation. This often implies that the equity will be acquired by a larger firm, and the value of acquisitions is often calculated with exit multiples. For my terminal value method, I decided to use a multiple of EBITDA at some exit multiples in the range of 5x to 8x (as described in the section: DCF based on EBITDA, CapEx, Working Cap, and Tax). Based on my data, a larger portion of over ~80% of our terminal value (or 20% of the present value) of the valuation was allocated to pay for M&A activities, my rough calculation follows.
Institution fund managers are just as capable of herding as at-home investors or retail investors, but they don’t tend to be quite as blatant about it, and market pricing tends to be more inefficient when retail ownership is higher. Much of the value of innovation flows such as metaverse and AI go to individual or private owners rather than institutions or public shareholders.
I certainly wouldn’t be paying skyrocketing valuations for AI-adjacent stocks, ensuring innovation flows go to private investors while public opportunities can be exploited (see Ownership Breakdown in SimplyWall.st).
Conclusion
This is simply the bare DCF numerical data, lacking the narrative of the story that can serve as a backup behind the numbers, and even a lack of other quantitative data measurable in numerical values. The other factors are the lack of analysts’ coverage of the company which may explain some of the differences in the market or my lack of understanding about the company’s advantages and vice-versa which is why investment could be tough 😊 Overall, either quantitative or/and story narrative valuation are not an exact science.
How about this article? My calculation error? How do you summarise it to a single DCF value? How you might justify your valuation? Could you spot any good prices? Cost of capital that investors are willing to pay for …
Your feedback can be written down here, feedbacks are welcome.