
Day 7: Understanding Processes and System Monitoring in Linux
Welcome to Day 7 of our DevOps in 90 Days Series! Today, we’re diving into the fascinating world of processes and system monitoring. If you’re like most Linux users, you probably spend a lot of time managing and troubleshooting processes. After all, Linux is a multitasking operating system, and process management is at the core of everything.
But first, what exactly is a process? Simply put, a process is a running instance of a program. When you open your favorite text editor, fire up a web server, or even just boot your system, you are starting processes. Some are in the foreground, while others quietly hum away in the background, making sure everything runs smoothly.
In this post, we’ll explore a few critical tools for process management and monitoring in Linux: ps, top, htop, and some advanced techniques for keeping your system under control. Along the way, we’ll sprinkle in some humor—because, let’s face it, staring at system metrics can sometimes be...well, mind-numbing!
1. The Basics: Checking Processes with ps
The ps command (short for process status) is your go-to for getting a snapshot of what's currently running on your system. Think of it like peeking into the backstage of a theater: you’ll see everything from the spotlight operator (your active foreground apps) to the stagehands running around making sure the show goes on (background processes).
ps aux
The above command gives you a list of every process running on your machine, along with details like the user who started it, the amount of CPU and memory it’s using, and when it was launched. The breakdown of the options:
a: Shows processes for all users.u: Displays user-oriented format (who's running the process, CPU and memory usage).x: Includes processes not attached to a terminal (those mysterious background processes).
It’s kind of like Ctrl + Alt + Delete for Linux, minus the panic button.
Fun Fact: The first time you use
ps aux, you might feel like you’re reading The Matrix. That’s normal.
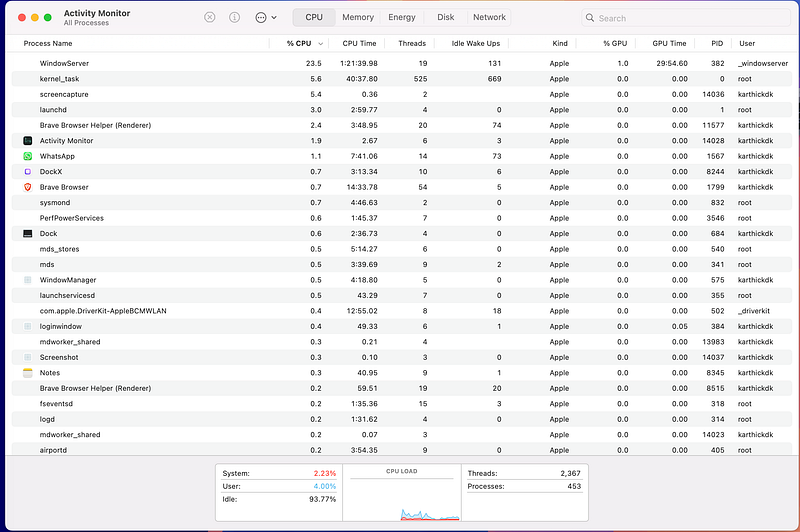
2. Keeping Tabs with top
Want something a bit more live? Say hello to top, the interactive cousin of ps. This tool continuously updates the status of your system’s processes in real-time, displaying the ones that are hogging your resources right at the top (pun intended).
Just type:
topYou’ll see something like this:
PID USER      PR  NI    VIRT    RES    SHR S  %CPU %MEM     TIME+ COMMAND
 1234 root      20   0  112m  56m 12m S   7.0  2.1  12:34.56 myprogram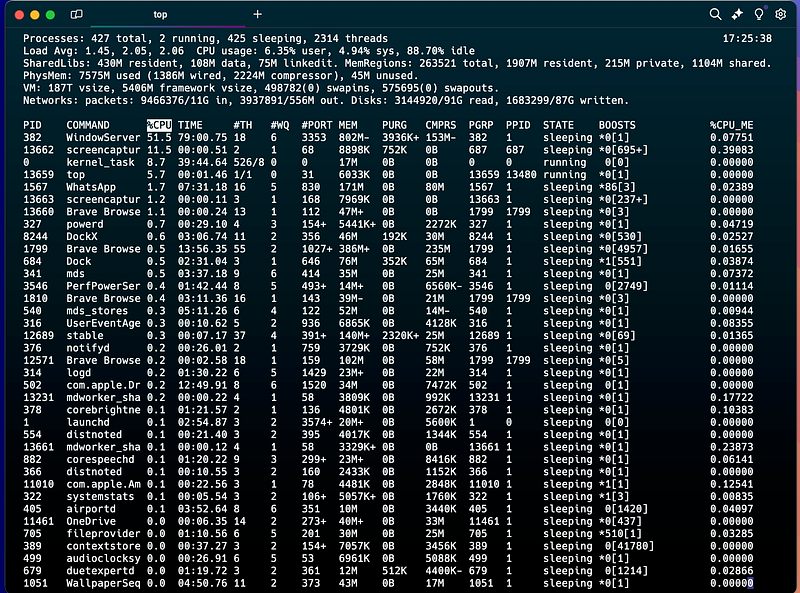
Here, you can track processes by PID, memory usage, CPU load, and more. It’s like watching the stock market… but for your system’s resources.
If things start looking red, and your system feels sluggish, it might be time to close a few memory-hogging processes.
Pro Tip: Hit the
qkey to quittopbefore you feel like you've entered a rabbit hole of never-ending numbers.
3. Enhanced Monitoring with htop
Now, if top is the dial-up internet of process monitoring, htop is your high-speed broadband. With a slick, colorful interface and easy-to-navigate menus, htop is a fan favorite for Linux admins who prefer something prettier than plain ol' text.
To install htop, run:
sudo apt install htop  # For Debian-based systems
sudo yum install htop  # For RHEL-based systems
Once installed, just type:
htop
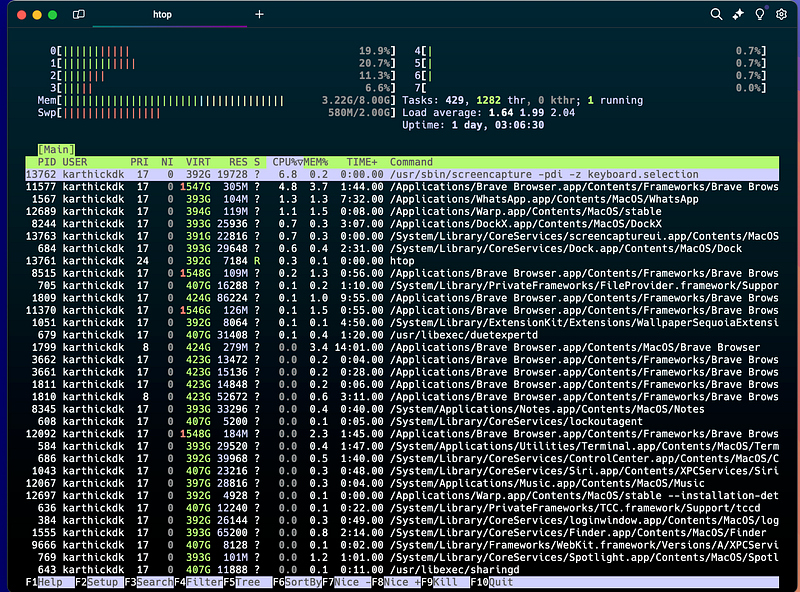
You’ll be greeted with a much more user-friendly interface that allows you to scroll through processes, filter by various metrics, and even kill processes directly with the F9 key.
Life Hack: Use
htopwhen you want to look like a Linux ninja in front of your coworkers.
4. Advanced Process Management: Beyond Basics
So, you’ve mastered ps, top, and htop. Now what? Let’s level up with some advanced process management tips:
a. Killing a Stubborn Process
Sometimes, processes refuse to die even after asking nicely. In those cases, you can use kill. Here’s how to gracefully tell a process to exit:
kill PIDReplace PID with the process ID (which you can find using ps or htop). If the process is especially stubborn, you may need to use the “ultimate solution”:
kill -9 PIDCaution: Don’t go around killing processes willy-nilly! Think of it like throwing water on a grease fire — use it carefully, or you might bring down the system.
b. Managing Process Priorities with nice and renice
Let’s say you have a process that’s hogging all your CPU. You don’t want to kill it, but maybe you’d like it to use fewer resources while you do something else. That’s where nice and renice come in. These commands let you adjust the priority of processes so they behave a little more...nicely.
To launch a process with a lower priority:
nice -n 10 myprogramTo change the priority of an existing process:
renice 10 PIDLower nice values mean higher priority. Just don't tell the processes—they can get a bit competitive.
5. Monitoring System Load and Performance
In addition to monitoring processes, it’s important to keep an eye on overall system performance. Here are a few quick tips:
1. Check Load Averages
The load average numbers in top or uptime give you a quick glance at how busy your system is over the last 1, 5, and 15 minutes. If the numbers exceed the number of CPU cores in your system, you’re in trouble.
2. Memory Usage
Linux is known for aggressive memory caching, so don’t panic if you see high memory usage in top. The key number to watch is how much of that is cached and available for new tasks.
3. Disk I/O with iostat
If your system feels sluggish but CPU and memory usage looks fine, you might be facing a disk I/O bottleneck. Install the sysstat package and use the iostat command to see if your drives are the culprit.
sudo apt install sysstat
iostat
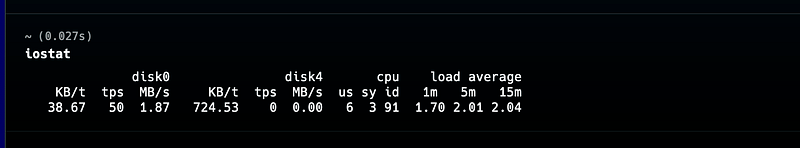
keeping a close eye on resource usage, including CPU, memory, disk I/O, and network activity, is critical for performance tuning iostat – Disk and CPU Performance Monitoring
The iostat (input/output statistics) tool is part of the sysstat package and is primarily used to monitor CPU utilization and I/O statistics for devices and partitions. It helps you understand how much load your disks are under and how efficiently they are handling that load.
a. Installing iostat
Before using, iostat you might need to install the sysstat package:
sudo apt install sysstat      # Debian/Ubuntu
sudo yum install sysstat      # RHEL/CentOS
b. Using iostat
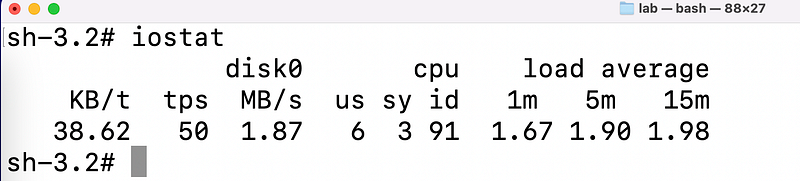
Running iostat without any arguments shows a summary of the system’s CPU and device I/O statistics:
iostat
A typical output looks like this:
avg-cpu:  %user   %nice %system %iowait  %steal   %idle
          4.20    0.00   1.50    2.10     0.00   92.20
Here’s a breakdown:
- %user: CPU time spent in user mode.
- %system: CPU time spent in kernel mode.
- %iowait: Time the CPU spends waiting for I/O operations to complete. A high
iowaitvalue means the system is likely bottlenecked by disk performance. - tps: Transactions per second.
- kB_read/s and kB_wrtn/s: The amount of data read from and written to the device per second.
c. Advanced Usage
You can use iostat with additional flags to customize the output:
- Monitoring at Intervals: To continuously monitor the system with updates every 5 seconds, use:
- Detailed Device Stats: For detailed statistics on specific devices, use the
-dflag:
iostat 2 5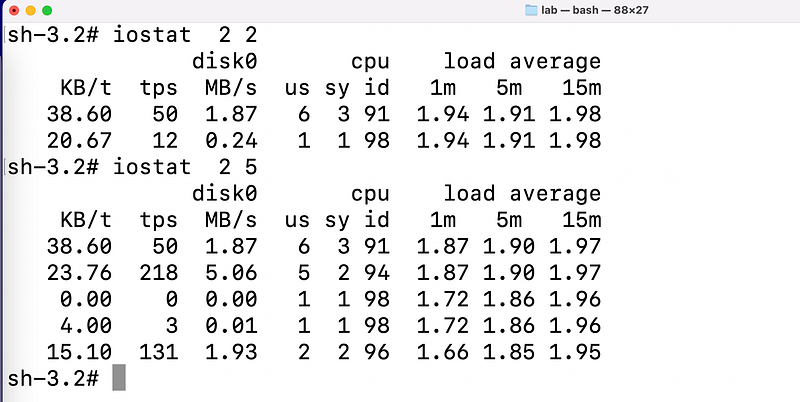
- Partition-Level Metrics: For more granular data, such as per-partition statistics, use:
Advanced Use Case: If you observe high
%iowaitvalues and low disk activity (tps), your system could be waiting for slow I/O, and you might need faster storage or a better disk configuration (RAID, SSDs, etc.).
2. vmstat – Virtual Memory and System Statistics
The vmstat (virtual memory statistics) tool is ideal for understanding system performance related to memory, swap, and CPU activity. It provides a broad overview of memory, process, I/O, and system-level metrics.
a. Running vmstat
When you run vmstat without any arguments, it displays system performance metrics since the last reboot:
vmstat
The output looks like this:
procs -----------memory---------- ---swap-- -----io---- -system-- ------cpu-----
 r  b   swpd   free   buff  cache   si   so    bi    bo   in   cs   us  sy  id  wa
 2  0      0  80000  10000 200000    0    0    10    20  100  200    5   1  90   4
Here’s how to interpret the columns:
- r: Number of runnable processes (waiting for CPU).
- b: Processes in uninterruptible sleep (waiting for I/O).
- swpd: Amount of virtual memory used.
- free: Free memory.
- buff: Buffer memory.
- cache: Cache memory.
- si / so: Swap in and swap out rates. High numbers here indicate swap activity, which could be a sign of insufficient physical memory.
- bi / bo: Blocks received (
bi) and sent (bo) to/from a block device (disk). - us / sy / id / wa: CPU time spent in user mode, system mode, idle, and waiting for I/O, respectively.
b. Monitoring Trends
You can run vmstat at intervals to get ongoing reports. For example, to see updates every 5 seconds, run:
vmstat 5This will give you real-time snapshots of your system’s resource usage and performance. This continuous output is particularly useful for tracking changes over time.
Advanced Use Case: When diagnosing performance issues, check for high
b(blocked processes) or swap activity (si,so). A system under heavy swap activity can suffer from poor performance due to excessive disk I/O.
3. sar – System Activity Report
The sar command is also part of the sysstat package and is a more comprehensive tool for collecting, reporting, and saving system activity data. Unlike iostat or vmstat, which only provide a snapshot in time, sar records data over time and allows you to analyze historical performance.
a. Installing sar
To install sar, ensure the sysstat package is installed:
sudo apt install sysstat
Enable sysstat data collection by editing /etc/default/sysstat and setting ENABLED="true". Then restart the service:
sudo systemctl restart sysstat
b. Running sar
You can run sar with a wide range of options to collect various types of system data:
- CPU Usage: View CPU utilization over time:
sar -u 5 3- This will output CPU stats every 5 seconds for a total of 3 samples.
- Memory Statistics: To see memory and swap usage over time:
sar -r 5 3- I/O Statistics: For disk I/O statistics:
sar -b 5 3- Network Statistics: You can also monitor network usage with:
sar -n DEV 5 3c. Historical Data Analysis
The key advantage of sar is that it logs performance data over time. You can analyze this data from the past by specifying a date:
sar -u -f /var/log/sysstat/sa10
This command retrieves CPU data from the sysstat log file for the 10th day of the month.
Advanced Use Case:
saris invaluable for long-term performance tuning. If you experience intermittent issues,sarcan help you pinpoint exactly when the problem occurred and which resources were under pressure.
4. Other Advanced Monitoring Tools
a. dstat
dstat combines the functionality of multiple tools like iostat, vmstat, and ifstat into a single, real-time monitoring tool. It provides a more flexible and human-readable output:
sudo apt install dstat
You can customize the output to include specific metrics like disk I/O, network, or memory statistics:
dstat -cdmn
b. nload
If you’re interested in detailed network statistics, nload provides a graphical view of network traffic in real-time:
sudo apt install nload

nload
c. atop
atop provides a more detailed overview of system performance, capturing resource consumption for each process and recording logs for future analysis:
sudo apt install atop
atop
Managing processes in Linux is a vital skill for any user or admin. Whether you’re killing a rogue process, adjusting priorities, or just keeping an eye on system performance, mastering tools like ps, top, htop, and nice will make your life much easier.
And remember, when in doubt, don’t panic — just fire up htop and pretend like you know what you’re doing. With Linux, half the battle is looking cool while you solve problems!
Advanced monitoring tools like iostat, vmstat, sar, and their companions (dstat, nload, atop) allow you to dig deep into system performance and resource usage. While top and htop give a real-time snapshot of system processes, these advanced tools help identify trends and uncover subtle performance bottlenecks that may only become evident after a period of observation.
Happy process hunting!
✅✅feel free to connect with us.
LinkedIn: https://www.linkedin.com/in/karthick-dkk/
For more updates: subscribe to this medium account.


