
Day 52: 60 days of Data Science and Machine Learning Series
Yellowbrick combines scikit-learn with matplotlib and provides the scikit-learn API to produce visualizations for the machine learning workflow. A good reference point to understand the vastness of Yellowbrick and how to use it —
Some of the other best Series —
100 days : Your Data Science and Machine Learning Degree Series with projects
Complete Data Visualization and Pre-processing Series with projects
Tech Newsletter —
If you are interested, you can join my newsletter through which I send tech interview tips, techniques, patterns, hacks — Software Development, ML, Data Science, Startups and Technology projects to more than 30K readers. You can subscribe to Tech Brew :
You can install yellowbrick using the command below —
$ pip install yellowbrickIn this post, we will analyze the text data using Yellowbrick and assess document similarity, topic modelling etc that are predicated on the notion of “similarity” between documents.
Let’s dive in!
Import necessary libraries
import matplotlib.pyplot as plt
%matplotlib inline
import pandas as pd
import warnings
import numpy as np
from pylab import rcParams
import seaborn as sns; sns.set(style="ticks", color_codes=True)
rcParams['figure.figsize'] = 15, 10warnings.simplefilter('ignore')from yellowbrick.features.importances import FeatureImportances
from sklearn.linear_model import Lasso
from yellowbrick.target import BalancedBinningReference
from yellowbrick.regressor import PredictionError
from sklearn.model_selection import train_test_split
from sklearn.model_selection import KFold
from yellowbrick.model_selection import CVScores
from yellowbrick.model_selection import LearningCurve
from sklearn.linear_model import LassoCVLoad Data
df = pd.read_csv('Path to the data file/data.csv')
df.info()
Output —
<class 'pandas.core.frame.DataFrame'>
RangeIndex: 1030 entries, 0 to 1029
Data columns (total 9 columns):
cement      1030 non-null float64
slag        1030 non-null float64
ash         1030 non-null float64
water       1030 non-null float64
splast      1030 non-null float64
coarse      1030 non-null float64
fine        1030 non-null float64
age         1030 non-null int64
strength    1030 non-null float64
dtypes: float64(8), int64(1)
memory usage: 72.5 KB
Data Preprocessing
f = [ 'cement','ash','slag','water','coarse','splast','fine','age']
target = 'strength'
X= df[f]
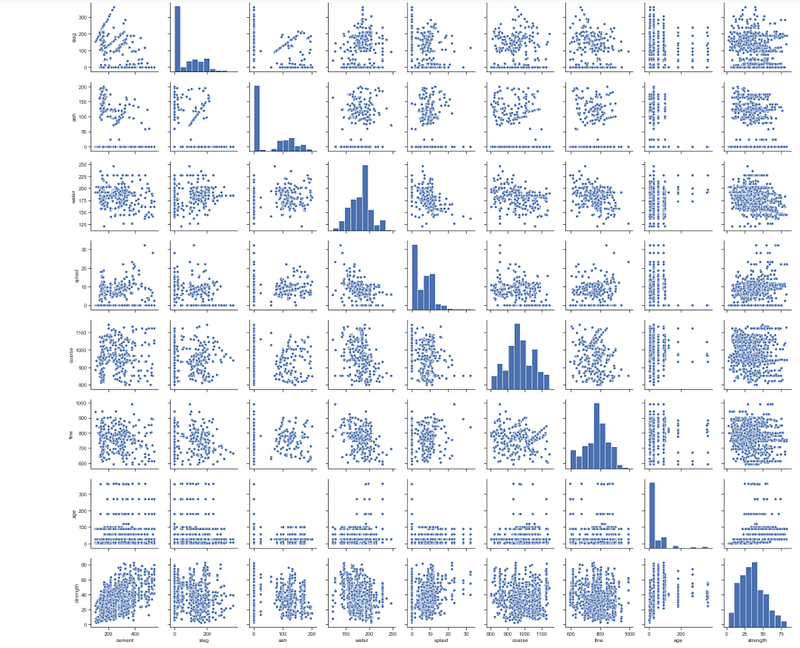
y = df[target]Pairwise Scatterplot
sns.pairplot(df)Output —
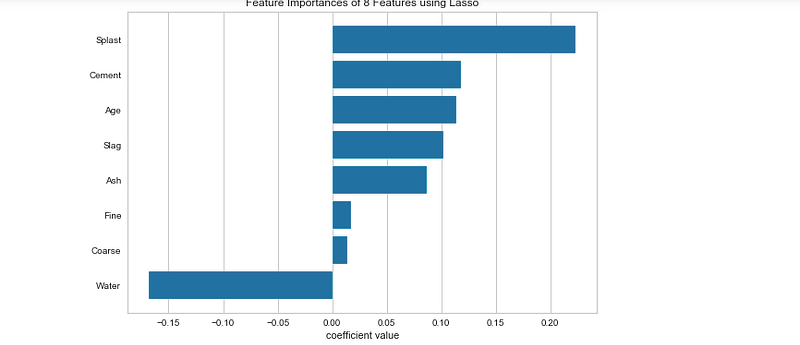
Feature Imp
fig = plt.figure()
ax = fig.add_subplot()
labels = list(map(lambda s: s.title(),f))
v = FeatureImportances(Lasso(),ax=ax,labels=labels,relative=False)
v.fit(X,y)
v.poof()Output —
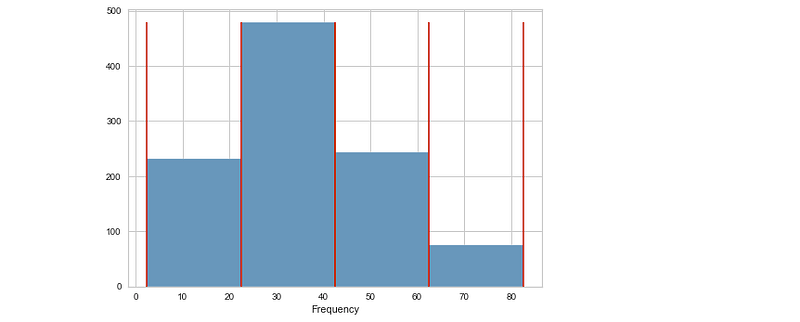
Visualize the target
v = BalancedBinningReference()
v.fit(y)
v.poof()
Output —
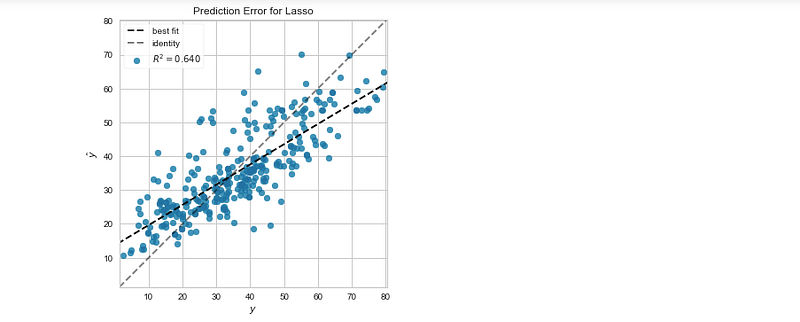
Evaluate Lasso Regression
X_train, X_test, y_train,y_test = train_test_split(X,y,test_size=0.3)
v = PredictionError(Lasso(),size=(600,400))
v.fit(X_train,y_train)
v.score(X_test,y_test)
v.finalize()
Output —
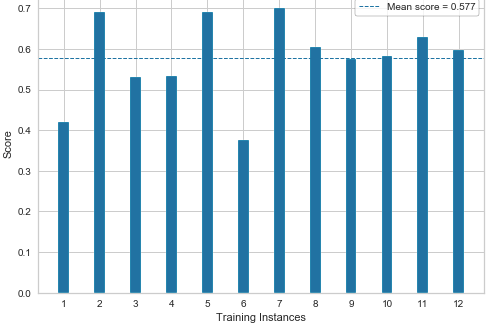
Cross Validation Scores
_,ax = plt.subplots()cv = KFold(12)
v = CVScores(Lasso(),ax=ax,cv=cv,scoring='r2')
v.fit(X_train,y_train).poof()Output —
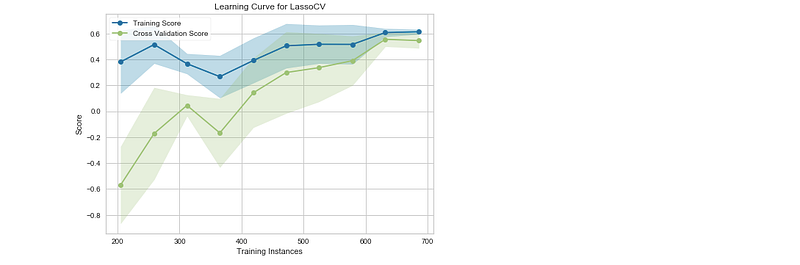
Learning Curves
s = np.linspace(0.3,1.0,10)
v=LearningCurve(LassoCV(),train_sizes=s,scoring='r2')
v.fit(X,y).poof()
Output —
Learnings —
How to perform performance evaluation of regression models using visual tools from Yellowbrick
Day 53: Coming soon!
Follow and Stay tuned. Keep coding :)
For other projects, tune to —
Build Machine Learning Pipelines( With Code)
Recurrent Neural Network with Keras
Clustering Geolocation Data in Python using DBSCAN and K-Means
Facial Expression Recognition using Keras
Hyperparameter Tuning with Keras Tuner
Custom Layers in Keras
That’s it fellas. Peace out and keep coding :)
Stay Tuned and of-course let me end this post with a quote by Steve Jobs ;)
“You have to be burning with an idea, or a problem, or a wrong that you want to right. If you’re not passionate enough from the start, you’ll never stick it out.”


