
Data Warehousing and Dimensional Modelling — Part 2 Fact Tables
This article continues the exploration of Data Warehousing and Dimensional Modelling. In this part, we will focus on designing Fact Tables
In the first module, we focussed on an overview of Data warehouse and dimensional modelling. In this part, we will focus on fact tables, specifically on designing fact tables.
Fact tables are one of the key components of a dimensional model in data warehousing. A fact table is a table that contains the metrics or measures associated with a fact, such as sales, inventory, or customer interactions. The fact table is the primary table in the dimensional model, and is typically connected to multiple dimension tables through foreign keys.
Understanding Fact Tables:
A fact table is designed to capture the numeric or quantitative data associated with a business process. It contains the facts or measurements of a business process, such as sales revenue, units sold, or profit margin. Fact tables are typically large and contain millions or billions of rows, as they capture detailed transactional data over a period of time.
Example of a Fact Table:
Let’s consider an example of a sales data warehouse to understand fact tables. The fact table in this case would contain the sales metrics associated with the sales process, such as sales revenue, units sold, and profit margin. The fact table would be connected to dimension tables such as product, customer, and time.
The fact table might look like this:
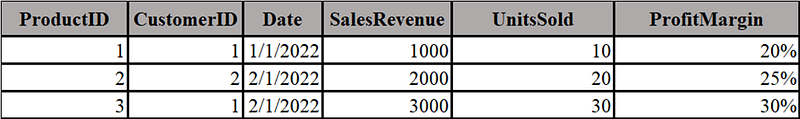
In this example, the fact table captures the sales revenue, units sold, and profit margin associated with each sale transaction. The fact table is connected to the product, customer, and time dimension tables(not shown here) through the foreign keys ProductID, CustomerID, and Date respectively.
By analyzing the fact table, users can gain insights into the sales performance of different products, customers, and time periods. They can slice and dice the data in different ways to answer business questions and make informed decisions.
Fact Table Design Principles:
The fact table is a fundamental component of a data warehouse, representing the primary source of information about business events or transactions. Here are some key design principles to consider when designing a fact table:
- Identify the grain: The grain of a fact table is the level of detail at which the data is captured. It is essential to identify the grain of the fact table, as it defines the level of aggregation and analysis possible in the data warehouse. The grain should be defined to capture the business event at its most atomic level.
- Choose the appropriate schema: There are three common schema designs for fact tables: star, snowflake, and constellation. The star schema is the most commonly used and the simplest to understand. It is a denormalized design that allows for fast queries and simple joins. The snowflake schema is a more normalized design, which can provide more flexibility in the data warehouse, but also more complex queries. The constellation schema is a hybrid of the star and snowflake schema and is often used for large data warehouses with multiple fact tables.
- Select the relevant measures: Measures are the numerical values that are stored in the fact table, representing the business events that have occurred. These measures should be selected based on the business requirements and should capture the relevant information required for analysis.
- Fact Types: Identify the types of facts to be stored in the fact table. There are three main types: additive (can be summed across dimensions), semi-additive (can be summed across some dimensions), and non-additive (cannot be summed). Understanding the fact types helps determine aggregation strategies and optimize query performance.
- Dimensions: Identify the dimensions that provide context to the facts. Dimensions are typically descriptive attributes, such as date, product, customer, or location. Ensure that the chosen dimensions align with the analysis and reporting requirements.
- Add foreign keys: Foreign keys link the fact table to the dimension tables, which provide context to the business events. It is important to include foreign keys to ensure that the fact table is correctly associated with the dimension tables.
- Avoid null values: Null values in a fact table can cause problems when performing calculations and analysis. It is important to avoid null values by setting default values or excluding incomplete data.
- Choose the appropriate type of index: There are different types of indexes that can be used in a fact table, including clustered, non-clustered, bitmap, and functional indexes. The type of index that is appropriate will depend on the specific requirements of the data warehouse and the types of queries that will be performed.
- Choose the appropriate partitioning method: Partitioning is an effective technique to improve query performance for large fact tables in a data warehouse. Partitioning involves dividing the fact table into smaller, more manageable sections based on a specific column or range of values. Different partitioning methods can be used, including range, list, and hash partitioning. The choice of partitioning method will depend on the specific requirements of the data warehouse and the types of queries that will be performed.
- Ensure data quality: The fact table should be designed to ensure data quality by implementing data validation rules, data cleaning processes, and data transformation techniques. These processes can help to identify and correct errors and inconsistencies in the data, ensuring that the fact table is an accurate representation of the business events.
- Compression: Compression is an important consideration when designing a fact table in a data warehouse. Compression is the process of reducing the amount of storage required for the fact table by encoding the data more efficiently. Different types of compression can be used in a fact table, including row-level compression, page-level compression, and column-store compression. The type of compression that is appropriate will depend on the specific requirements of the data warehouse and the types of queries that will be performed.
- Data volume: The fact table can become very large in size, especially in large data warehouse environments. It is important to consider the volume of data that will be stored in the fact table and to ensure that the hardware and software infrastructure can support the data warehouse requirements.
Best Practices for Designing Fact Tables:
- Use Surrogate Keys: Surrogate keys are system-generated keys used to uniquely identify records in a fact table. They help maintain referential integrity, facilitate updates, and improve query performance.
- Normalize Dimensions: Normalize the dimension tables to minimize redundancy, ensure consistency, and simplify updates. However, fact tables should be denormalized to optimize query performance.
- Partitioning: Partition the fact table to improve query performance and manageability. Partitions can be based on date, range, or other criteria, depending on the data distribution and usage patterns.
- Indexing: Create appropriate indexes on the fact table to optimize query performance. Consider using bitmap indexes for low-cardinality columns and B-tree indexes for high-cardinality columns.
- Materialized Views and Aggregations: Use materialized views and precomputed aggregations to store summarized data, reducing the time and resources required for querying large fact tables.
Fact Table Structure:
A fact table typically consists of the following components:
- Fact table key: A unique identifier for the fact table.
- Foreign keys: Foreign keys are used to connect the fact table to the dimension tables.
- Measures: The measures captured in the fact table, such as sales revenue, units sold, or profit margin.
- Date or time dimension: A date or time dimension is often included in the fact table to enable analysis of data across different time periods.
- Other dimensions: Other dimensions may be included in the fact table based on the business requirements.
Potential Challenges:
Various challenges can be faced with fact tables. The most important challenges and the ways to address them are listed below.
- Data Volume: Large fact tables can strain system resources and degrade query performance. To address this issue, implement partitioning, indexing, and materialized views to optimize performance.
- Data Quality: Poor data quality can lead to inaccurate or misleading analysis. Implement data validation, cleansing, and transformation processes during the ETL (Extract, Transform, Load) stage to ensure data consistency and accuracy.
- Scalability: As data volume grows, the data warehouse may struggle to accommodate it. Adopt scalable architectures and technologies, such as columnar storage, distributed systems, or cloud-based solutions, to handle increasing data volumes.
Designing Fact Table In Action: Step by Step Illustration
To illustrate the design of a fact table, let’s consider a simplified example of an e-commerce company that wants to analyze their sales data.
Assume the company has the following data:
- Sales transactions with product ID, customer ID, date, and quantity sold.
- Product information with product ID, product name, category, and price.
- Customer information with customer ID, name, email, and location.
Step 1: Identify the facts (measurable data) and dimensions (contextual data)
Facts:
- Quantity sold
- Sales amount (calculated by multiplying quantity sold by product price)
Dimensions:
- Date (from sales transactions)
- Product (from product information)
- Customer (from customer information)
Step 2: Define granularity for the fact table.
In this example, we choose the granularity at the transaction level, where each record represents a single product sold in a transaction.
Step 3: Create the fact table with columns for the facts and foreign keys to the dimension tables.
Fact table: Sales_Fact
- Sales_ID (primary key)
- Date_ID (foreign key to Date_Dimension)
- Product_ID (foreign key to Product_Dimension)
- Customer_ID (foreign key to Customer_Dimension)
- Quantity_Sold
- Sales_Amount
Step 4: Create dimension tables with columns for the descriptive attributes.
Dimension table: Date_Dimension
- Date_ID (primary key)
- Date
- Day
- Month
- Year
- Quarter
Dimension table: Product_Dimension
- Product_ID (primary key)
- Product_Name
- Category
- Price
Dimension table: Customer_Dimension
- Customer_ID (primary key)
- Name
- Location
Step 5: Replace the natural keys in the fact table with surrogate keys
This helps to improve performance and maintain referential integrity.
Step 6: Populate the fact and dimension tables
Load data into the fact and dimension tables using the ETL (Extract, Transform, Load) process. This may involve data cleansing, validation, and transformation.
The resulting fact and dimension tables can now be used to analyze sales data and generate reports based on various dimensions, such as sales by date, product, customer, or location.
Sample Table Data:
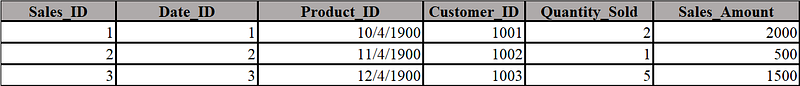
Sales Fact Table:
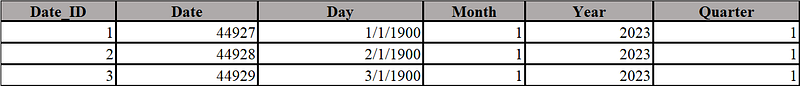
Date Dimension:
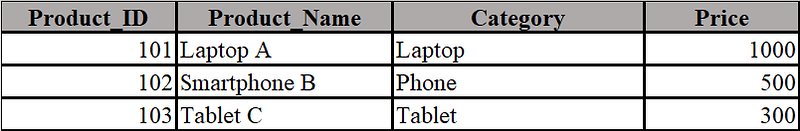
Product Dimension:
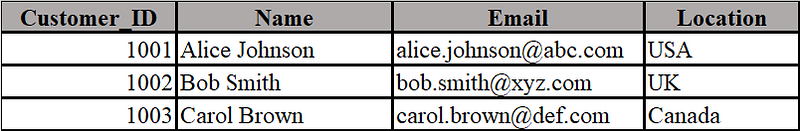
Customer Dimension:
Example of a Fact Table Designed from OLTP System:
In this example, we will see how to convert a set of normalized tables in OLTP systems for a retail company into tables in a data warehouse. We will use sample data from the OLTP tables and transform them into the corresponding dimension and fact tables in the data warehouse. The OLTP system consists of sales transactions, sales returns as well as customer rewards table.
Sample data for the OLTP tables:
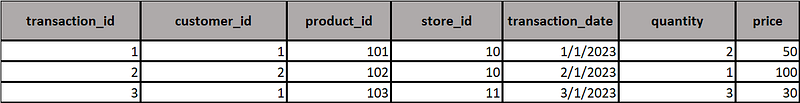
Sales_transaction:
Sales_return:

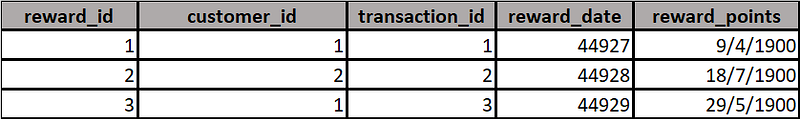
Cutomer_reward:
Sample data for the Data Warehouse tables:
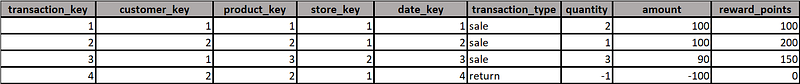
Transaction Fact Table:
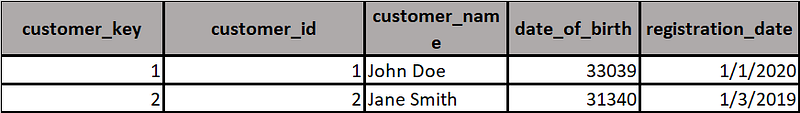
Customer Dimension:
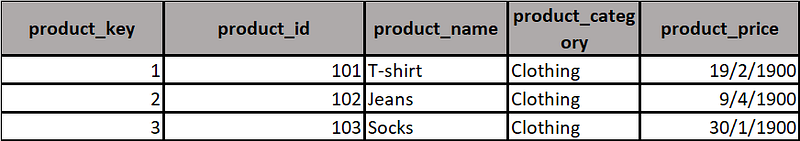
Product Dimension:
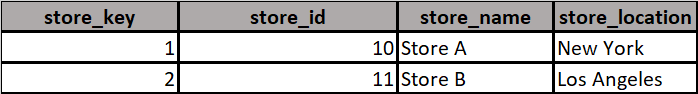
Store Dimension:
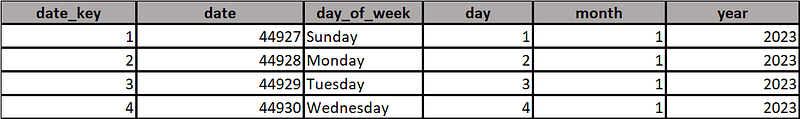
Date Dimension:
Here in the transaction fact table, we have combined sales, sales return, and customer reward transactions. We have also added a transaction_type column to distinguish between the different types of transactions. The transaction fact table is now the central fact table that connects to the customer dimension, product dimension, store dimension, and date dimension tables, allowing users to analyze the data in various ways.
With this new dimensional model, retail company analysts can efficiently analyze transactions and generate reports based on various dimensions, such as:
- Sales by product category and store location
- Sales returns by customer demographics and product category
- Reward points earned by customers over time
- Sales trends by day of the week, month, or year
This dimensional model provides a robust and flexible framework for analyzing the retail company’s data while maintaining high performance and ease of use for end-users.
Focusing on the fact table conversion, here are the design principles followed in our example when transforming the OLTP tables to the transaction fact table in the data warehouse:
- Identifying the business process: We focused on the retail company’s transaction process, which includes sales, sales returns, and customer rewards. This helped us determine the scope of the data that needs to be stored in the fact table.
- Determining the granularity: In our example, we chose the transaction level as the granularity, capturing individual sales, sales returns, and customer reward transactions. This decision impacted the structure and content of the fact table.
- Combining multiple OLTP tables: We combined data from three OLTP tables (sales_transaction, sales_return, and customer_reward) into a single fact table, transaction fact. This enables easier analysis and reporting of transaction data in the data warehouse.
- Surrogate Keys: We used surrogate keys for the primary keys in the dimension tables (customer_key, product_key, store_key, date_key) and the fact table (transaction_key). These surrogate keys are used to establish the relationships between the fact table and the dimension tables, allowing users to analyze the data based on various dimensions.
- Including foreign keys to dimensions: In the transaction fact table, we included foreign keys to the dimension tables (customer_key, product_key, store_key, date_key). These keys establish the relationships between the fact table and dimension tables.
- Adding a transaction_type column: We added a transaction_type column to the transaction fact table to distinguish between different types of transactions (sales, returns, rewards). This allows users to filter and aggregate data based on the type of transaction.
- Storing numeric measures (facts): In the transaction fact table, we stored the numeric measures (quantity, amount, reward_points) for each transaction. These measures represent the business data that users will analyze, aggregate, and report on.
- Denormalizing data: Unlike the OLTP tables that are normalized, we denormalized the data in the fact table. This simplifies the structure of the table and improves query performance in the data warehouse.
By following these design principles, we successfully transformed the data from multiple OLTP tables into a single fact table that is suitable for analysis and reporting in a data warehouse environment.
Materialized Views:
The fact and dimension tables created above can be used to create materialized views and precomputed aggregations to store summarized data, reducing the time and resources required for querying large fact tables.
Let’s create a materialized view for a retail data warehouse that aggregates sales data by product category and month. This view can be useful for analyzing monthly sales trends across different product categories. Here’s the SQL statement to create the materialized view using the transaction fact and associated dimension tables:
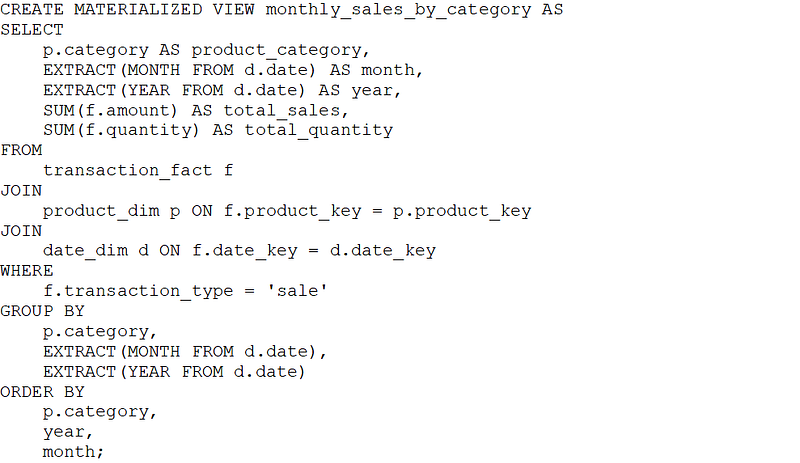
This materialized view, monthly_sales_by_category, precomputes and stores the aggregated sales data by product category and month, making it faster to retrieve this information for analytical queries and reports. It joins the transaction fact table with the product dimension and date dimension tables to obtain the required data and performs the aggregation using the SUM() function.
Conclusion:
The design of a fact table plays a pivotal role in the success of a data warehouse implementation. Fact tables serve as the foundation of a dimensional model, allowing organizations to perform in-depth analysis and generate insightful reports across multiple dimensions. By following best practices and design principles, businesses can create fact tables that deliver performance, scalability, and flexibility.
Key aspects of fact table design include identifying the relevant business processes, determining the appropriate granularity, and establishing relationships with corresponding dimension tables. These factors contribute to a fact table that can accommodate diverse analytical requirements and effectively support decision-making processes.
In addition, the use of surrogate keys, denormalization, and strategic handling of dimensions ensures data consistency, streamlined data integration, and improved query performance. These characteristics are crucial for maintaining a data warehouse that can evolve with the ever-changing needs of an organization.
Furthermore, monitoring and optimizing fact table performance through indexing, partitioning, and the use of materialized views and aggregations can significantly enhance the overall efficiency of a data warehouse. As a result, organizations can leverage their data assets to make informed, data-driven decisions that promote growth and competitiveness.
In essence, a well-designed fact table is the cornerstone of a successful data warehouse. By adhering to established design principles and continuously refining the fact table structure, organizations can unlock the full potential of their data and harness the power of analytics to drive strategic decision-making and long-term success.
There are other aspects of fact tables (like different types of fact tables) that are not discussed here. Also, the dimensional modelling itself has many more topics. I hope to cover them in the future articles.