
Data Warehousing 101: Different Layers In The Data Warehouse

In this article, we will cover what a data warehouse is, and how you can make the most out of one through the introduction of different layers.
A data warehouse in this context is simply a collection of structured, tabular data ready for analytics (data models; SQL tables or views). Think of it as a secure data repository, a central hub where all your data converges, gets cleansed, and becomes a single source of truth. Depending on your situation, it can be a great first step in your analytics journey with a relatively low barrier to entry.

From an analytics perspective, data warehouses have 3 key benefits:
1. Central Location for Analytics Data: The Source of Truth
It’s not difficult to imagine how a business can have multiple sources of data with disagreeing answers to the same question.
By bringing together these different data sources into a single place to be combined and cleaned, data warehouses can accommodate a singular source of truth for analytics. It functions as a centralised repository, ensuring that all your analyses draw from a uniform dataset.
2. Decoupled from Production Data: De-risked from Incidents
A critical feature of the data warehouse is its separation from production data in terms of storage and compute (instead of querying the production database, you bring a copy of that data into a warehouse first).
Through this, your production data remains shielded from the potential chaos of analytical operations. Even if errors occur during queries and analysis, the business continuity and customer experience are not impacted. This facilitates rapid development with almost no risk.
3. Adding Value from Day 1: Bottom of Maslow’s Hierarchy of Data Needs
Analogous to Maslow’s hierarchy of needs, data also has foundational requirements. At the base, it’s imperative to have immediate access to the right data.

Before any fancy AI use-cases, being able to answer basic business questions and reliably track KPIs is the low-hanging value-add of the data function.
In some contexts, data warehouses can be the fastest and most flexible tool to climb this hierarchy of needs from the bottom, while also serving as a reliable bedrock for advanced AI / ML applications.
Different layers in a data warehouse
It’s important to note that there are almost no black or white rules in structuring your data warehouse.
This guide shares what I saw that works well, but at core, designing your data warehouse is a creative, flexible and pragmatic process to cater your organisation’s unique needs.
Turning raw data into a format fit for analysis is a complex process. This complexity only scales exponentially as your analytical needs grow — with more data sources coming together to answer increasing types of questions.
Thanks to the decreasing cost of cloud compute and storage, we can now design data warehouses in a way that focuses on scaling use cases and delivering business value over other things. This is where the different layers in a data warehouse come in.
In a modern data warehouse operating under ELT, there are different layers with distinct roles to manage this process and deliver the data to end-users. They are:
- Staging layer — Data from different sources are cleaned and integrated into the warehouse.
- Modelling layer — Staged models are transformed into useful structures, enriched with analytical fields, following designs like the star schema.
- Exposure layer — Models derived from modelling layer for specific use-cases like dashboards and reports. Anyone in the organisation can access this layer for analysis.
The separation of layers makes managing data quality, change and security management significantly easier.
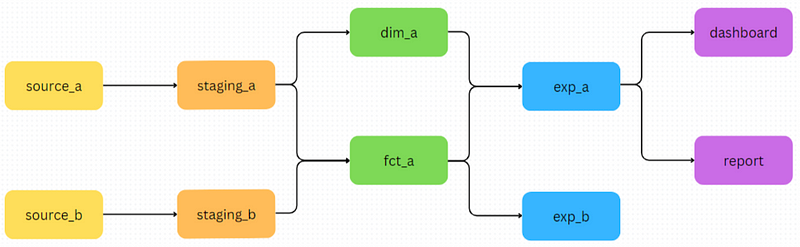
From here onwards, we will represent the flow of data through the different data warehouse layers with DAGs (directed acyclic graphs). In this context, we use DAGs to visualise lineage and dependencies between different data models.
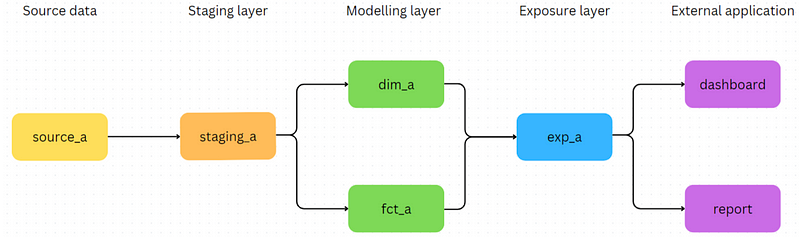
For example, in the diagram above, the data model staging_a is built from source_a, dim_a is built from staging_a and so on.
Towards the end of this article, we will go through an example to better illustrate how these layers are used in practice.
Staging layer
Staging layer simplifies incoming source data for the rest of the warehouse.
Its primary function is to clean the data, making it consistent with the established standards of the data warehouse. This involves tasks such as converting time zones, adjusting data types, renaming tables, stamping loaded datetimes and columns to conform to the warehouse’s conventions, handling private fields and potentially rectifying historical data issues.
Staging models are not designed to compute new columns or perform complex transformations, as not all downstream use cases require these metrics. Instead, they act as the single point of quality control for the rest of the warehouse for each data source to promote efficiency and data integrity.
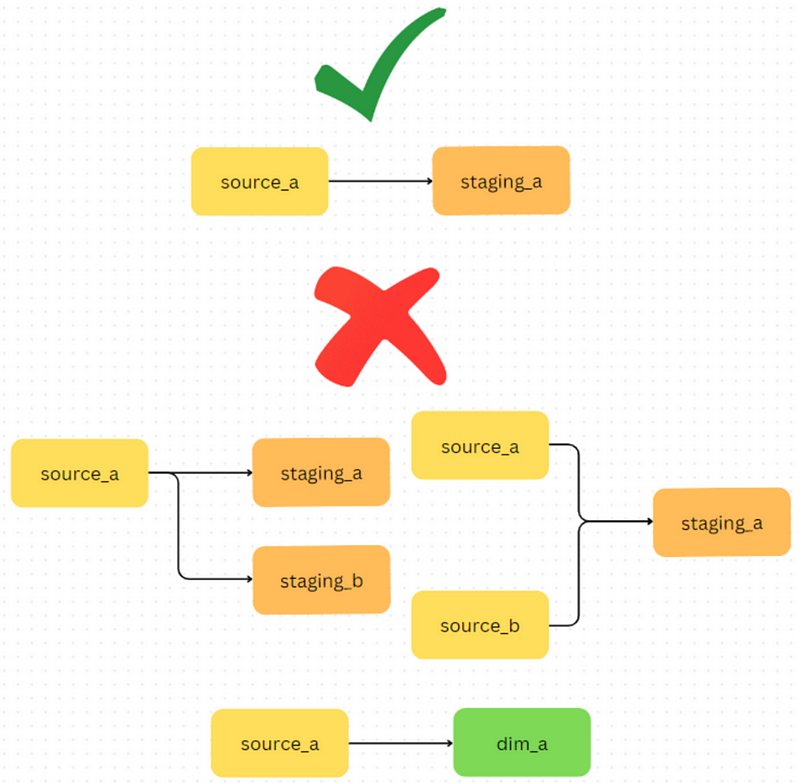
This is why it’s important that every source table has a single staging model depending on it.
Modelling layer
In the modelling layer of a data warehouse, we focus on data modelling and shaping for analytical purposes. This involves joining different models, defining new fields or aggregating metrics. Here, data models are organised into popular schemas such as the star schema, data vault or the activity schema representing different business entities and activities. You can even leverage multiple of these patterns together in different areas of the warehouse based on your needs.
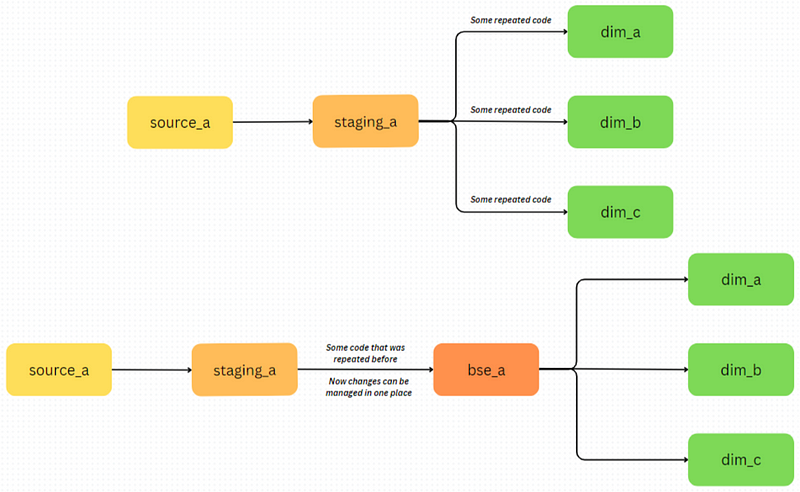
When confronted with extensive and intricate transformations that require repetition across various models, it’s practical to consider the introduction of intermediary models known as the “base models.” You could think of them as “functions” from programming, making it easier to manage repeated code from a single place.
Exposure layer
Models in the exposure layer of the data warehouse are derived from the modelling layer, tailored for specific use-cases such as dashboards and reports. This could look like anything from building an entirely different table or simply creating a copy of a modelling layer model made accessible for the rest of the organisation.
By keeping this layer separate from the modelling layer, we avoid cluttering the latter with columns that have one-time or limited usage. It also makes access control easier on an individual use-case level at each exposure table.
Exposure models are optimised for faster response times (e.g. kept as tables over views), since there are often business use-cases depending on them.
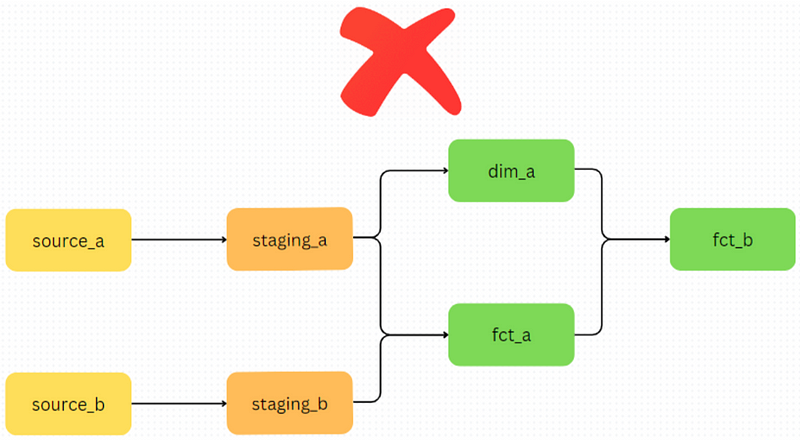
Finally, across all layers, data models should only reference tables in the previous layers to promote traceability and avoid circular reference.
Example: Modelling customer orders
Let’s go through a simple example to show how these layers get used. Suppose we have an online store with 2 very simple tables, with the goal of doing some basic analytics:
Customers
- Customer_ID: Customer’s unique ID.
- Email: Customer’s email.
- Address: Customer’s address.
- Country: The country the customer’s account is in.
Orders
- Order_ID: Order’s unique ID.
- Customer_ID: ID of the customer who made the purchase.
- Order_Date: The date when the order was made.
- Order_Value: How much the transaction was.
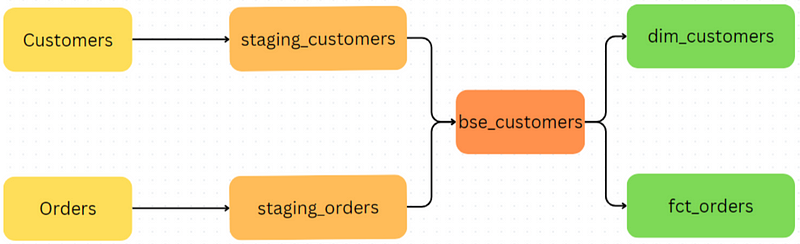
In any scenario, the first thing to do is create a staging model for each of our tables. Some things that might occur in this step include masking sensitive data (customer email and address), stamping loaded datetimes and filtering any known invalid data.

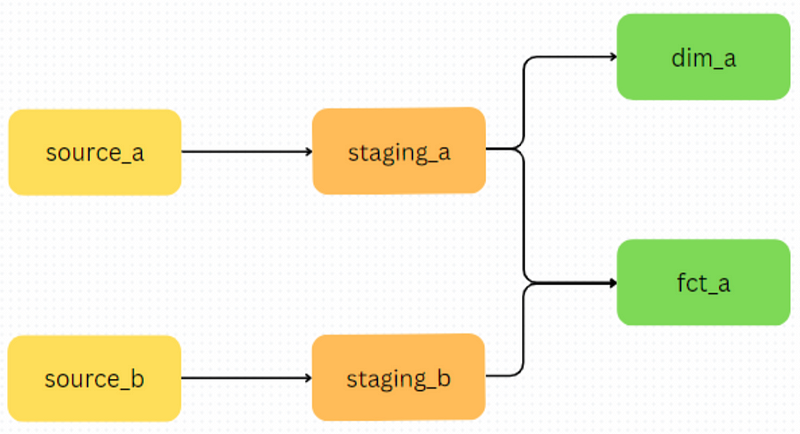
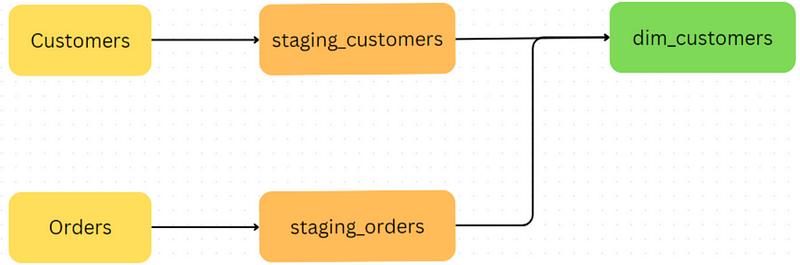
In the modelling layer, we want to create enriched versions of these models that can answer common business questions.
For example, dim_customers model might include extra columns like ‘Customer Tier’ that depend on how much money they spent from staging_orders. We may also create a ‘Continent’ column based on the existing ‘Country’ column, or ‘First_Order_Date’ from staging_orders. This will help us quickly segment our customers by different attributes.
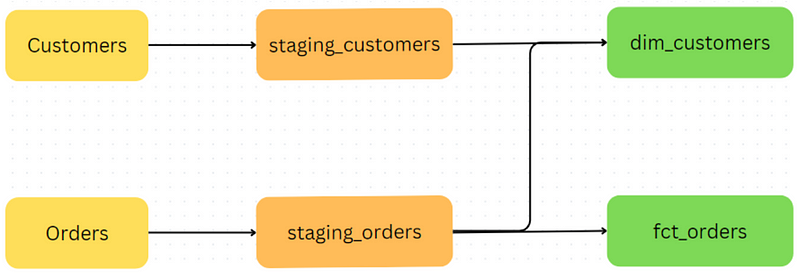
We can also create a fct_orders model which can show our revenue over time from the staging_orders model.
One common use case of this model would be to analyse the revenue over time trend by different segments or cohorts of customers. In that case, it would be useful to include some fields in dim_customer like ‘Customer Tier’, ’Country’ and ‘First_Order_Date’ derived from staging_customers.
But instead of repeating these transformations for both dim_customers and fct_orders, we can perform all customer-related transformations in an intermediate bse_customers model. This is particularly useful if you have an ever-growing number of models dependent on these same transformed customer fields.
Finally, let’s imagine we were asked to build a report of our orders summarised by month, connected to an external visualisation tool. In this case, we would create an exp_orders_monthly model — a version of fct_orders grouped by month for this particular request that can be connected to a visualisation tool.
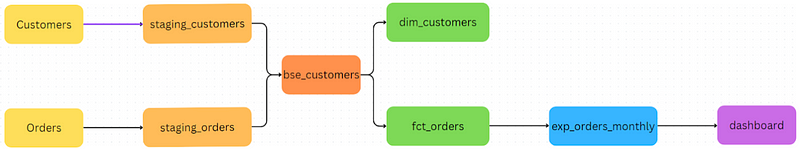
While this might seem like an overkill in this simple example, separate exposure models are particularly useful when more complex transformations difficult to perform in an external visualisation tool are needed. You may also want the visualisation tool to only access your exposure model, instead of the entire warehouse. More importantly, our fct_orders model itself is not changed by this single request!
Getting started
If you are looking to implement a data warehouse for your organisation, this is one of the potential stacks with free tiers to get started with:
- Google Cloud Platform Big Query — The data warehouse.
- Fivetran (The “EL” in ELT) — Ingesting data from different sources to the data warehouse
- dbt Cloud (The “T” in ELT) — Data transformation with software engineering principles (version control, tests and documentation). Their free starter course is also great!
As well as being free, this stack is one of the most popular in the modern data landscape, and can continue to scale as your analytical requirement grows.