
Data Warehouse on Kubernetes
ClickHouse Operator to the rescue
I won’t go into too much detail on why you should consider ClickHouse as your data warehouse since there are a number of articles out there. You can also check my previous articles Setting up a local datawarehouse and Build your own data platform if you want to get acquainted.
The scope of this article is for you to deploy a production-ready ClickHouse environment inside Kubernetes with persistent storage. You will find a lot of detailed information provided by Altinity since they are the creators of this operator. This article will allow you to have a production-ready data warehouse.
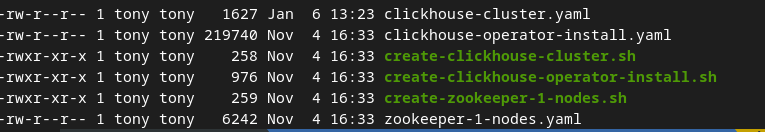
So to be able to follow the below steps make sure you have a Kubernetes environment available. In my case, I am using a minikube environment. At the end of the below steps you will end up with the following files:
1) Deploy clickhouse-operator
Instead of pasting a huge yaml file in this article (since the clickhouse-operator is pretty huge) then copy the contents found in the below link and name this file clickhouse-operator-install.yaml:
To deploy this manifest we will create another script:
#!/bin/bash

CH_NAMESPACE="${CH_NAMESPACE:-clickhouse-operator}"

CUR_DIR="$(cd "$(dirname "${BASH_SOURCE[0]}")" >/dev/null 2>&1 && pwd)"

kubectl create namespace "${CH_NAMESPACE}"

kubectl apply -n "${CH_NAMESPACE}" -f "${CUR_DIR}/clickhouse-cluster.yaml"
Save this file as create-clickhouse-operator-install.sh . The script will take care of creating a namespace (in our case clickhouse-operator) and apply this manifest there. Simply run the following in the directory of the file:
./create-clickhouse-operator-install.sh1.1) Check the clickhouse-operator
If the pod status is running, the clickhouse operator deployment is successful. The status of the pods can be viewed through the following command:
kubectl get all -n clickhouse-operator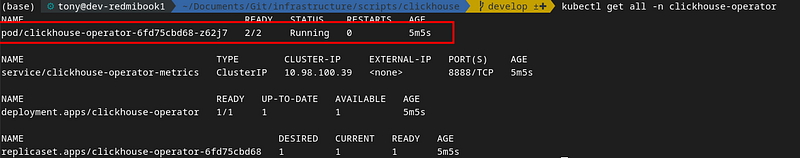
To add with the above yaml file, essentially there are two ConfigMaps that contain CH settings that are important to us being the etc-clickhouse-operator-usersd-files & etc-clickhouse-operator-configd-files.
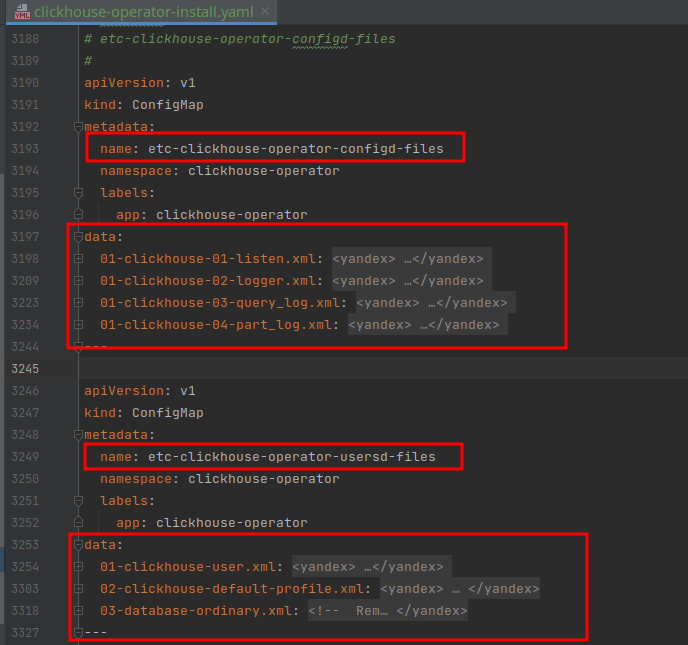
These interact directly with the actual ClickHouse settings which would be specified in ClickHouse/config.xml or ClickHouse/users.xml respectively. Here the operator takes care of propagating those changes.
Once the operator is running it will listen to ClickHouseInstallation manifest and create an instance based on the specs. Also if a specific cluster is changed or scaled up/down, the operator will notice the change in ConfigMap and apply it to the cluster
2) Deploy the cluster
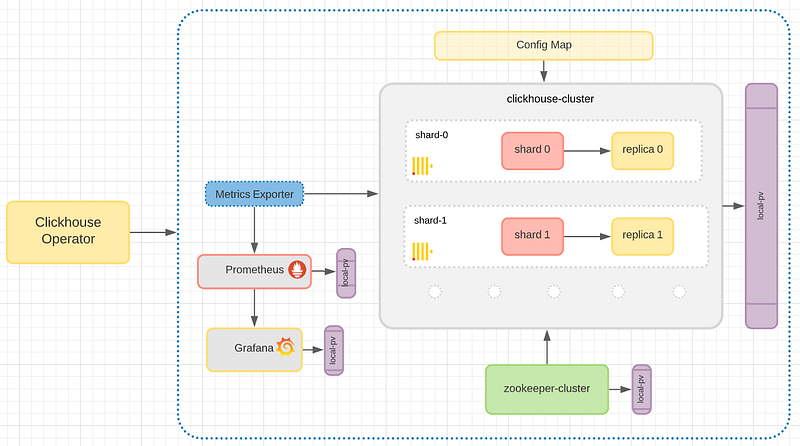
If you take a close look at the figure of the Data Warehouse, you will notice a cluster of 2 shards and 2 replicas. The storage of each pod uses the way of local persistent volume.
2.1) Deploy Zookeeper
Together with this ClickHouse cluster, a Zookeeper cluster is required since we are going to use Replication. If only shards are going to be used, Zookeeper can be skipped.
You can decide how many replicas you want. To keep things simple we will go with 1 replica so only 1 Zookeeper pod (I don’t recommend this manifest to be in production ideally more replicas are added) … You can use any image or managed service of your liking, as long as you have a zookeeper host and port that can be used by the ClickHouse Cluster
So copy the contents found below and paste them into a file named zookeeper-1-nodes.yaml:
# Setup Service to provide access to Zookeeper for clients
apiVersion: v1
kind: Service
metadata:
  # DNS would be like zookeeper.zoons
  name: zookeeper
  labels:
    app: zookeeper
spec:
  ports:
    - port: 2181
      name: client
    - port: 7000
      name: prometheus
  selector:
    app: zookeeper
    what: node
---
# Setup Headless Service for StatefulSet
apiVersion: v1
kind: Service
metadata:
  # DNS would be like zookeeper-0.zookeepers.etc
  name: zookeepers
  labels:
    app: zookeeper
spec:
  ports:
    - port: 2888
      name: server
    - port: 3888
      name: leader-election
  clusterIP: None
  selector:
    app: zookeeper
    what: node
---
# Setup max number of unavailable pods in StatefulSet
apiVersion: policy/v1beta1
kind: PodDisruptionBudget
metadata:
  name: zookeeper-pod-disruption-budget
spec:
  selector:
    matchLabels:
      app: zookeeper
  maxUnavailable: 1
---
# Setup Zookeeper StatefulSet
# Possible params:
# 1. replicas
# 2. memory
# 3. cpu
# 4. storage
# 5. storageClassName
# 6. user to run app
apiVersion: apps/v1
kind: StatefulSet
metadata:
  # nodes would be named as zookeeper-0, zookeeper-1, zookeeper-2
  name: zookeeper
spec:
  selector:
    matchLabels:
      app: zookeeper
  serviceName: zookeepers
  replicas: 1
  updateStrategy:
    type: RollingUpdate
  podManagementPolicy: Parallel
  template:
    metadata:
      labels:
        app: zookeeper
        what: node
      annotations:
        prometheus.io/port: '7000'
        prometheus.io/scrape: 'true'
    spec:
      containers:
        - name: kubernetes-zookeeper
          imagePullPolicy: IfNotPresent
          image: "docker.io/zookeeper:3.6.3"
#          resources:
#            requests:
#              memory: "128M"
#              cpu: "1"
#            limits:
#              memory: "1Gi"
#              cpu: "2"
          ports:
            - containerPort: 2181
              name: client
            - containerPort: 2888
              name: server
            - containerPort: 3888
              name: leader-election
            - containerPort: 7000
              name: prometheus
          # See those links for proper startup settings:
          # https://github.com/kow3ns/kubernetes-zookeeper/blob/master/docker/scripts/start-zookeeper
          # https://clickhouse.yandex/docs/en/operations/tips/#zookeeper
          # https://github.com/ClickHouse/ClickHouse/issues/11781
          command:
            - bash
            - -x
            - -c
            - |
              SERVERS=1 &&
              HOST=`hostname -s` &&
              DOMAIN=`hostname -d` &&
              CLIENT_PORT=2181 &&
              SERVER_PORT=2888 &&
              ELECTION_PORT=3888 &&
              PROMETHEUS_PORT=7000 &&
              ZOO_DATA_DIR=/var/lib/zookeeper/data &&
              ZOO_DATA_LOG_DIR=/var/lib/zookeeper/datalog &&
              {
                echo "clientPort=${CLIENT_PORT}"
                echo 'tickTime=2000'
                echo 'initLimit=300'
                echo 'syncLimit=10'
                echo 'maxClientCnxns=2000'
                echo 'maxSessionTimeout=60000000'
                echo "dataDir=${ZOO_DATA_DIR}"
                echo "dataLogDir=${ZOO_DATA_LOG_DIR}"
                echo 'autopurge.snapRetainCount=10'
                echo 'autopurge.purgeInterval=1'
                echo 'preAllocSize=131072'
                echo 'snapCount=3000000'
                echo 'leaderServes=yes'
                echo 'standaloneEnabled=false'
                echo '4lw.commands.whitelist=*'
                echo 'metricsProvider.className=org.apache.zookeeper.metrics.prometheus.PrometheusMetricsProvider'
                echo "metricsProvider.httpPort=${PROMETHEUS_PORT}"
              } > /conf/zoo.cfg &&
              {
                echo "zookeeper.root.logger=CONSOLE"
                echo "zookeeper.console.threshold=WARN"
                echo "log4j.rootLogger=\${zookeeper.root.logger}"
                echo "log4j.appender.CONSOLE=org.apache.log4j.ConsoleAppender"
                echo "log4j.appender.CONSOLE.Threshold=\${zookeeper.console.threshold}"
                echo "log4j.appender.CONSOLE.layout=org.apache.log4j.PatternLayout"
                echo "log4j.appender.CONSOLE.layout.ConversionPattern=%d{ISO8601} [myid:%X{myid}] - %-5p [%t:%C{1}@%L] - %m%n"
              } > /conf/log4j.properties &&
              echo 'JVMFLAGS="-Xms128M -Xmx1G -XX:+UseG1GC -XX:+CMSParallelRemarkEnabled"' > /conf/java.env &&
              if [[ $HOST =~ (.*)-([0-9]+)$ ]]; then
                  NAME=${BASH_REMATCH[1]}
                  ORD=${BASH_REMATCH[2]}
              else
                  echo "Failed to parse name and ordinal of Pod"
                  exit 1
              fi &&
              mkdir -p ${ZOO_DATA_DIR} &&
              mkdir -p ${ZOO_DATA_LOG_DIR} &&
              export MY_ID=$((ORD+1)) &&
              echo $MY_ID > $ZOO_DATA_DIR/myid &&
              for (( i=1; i<=$SERVERS; i++ )); do
                  echo "server.$i=$NAME-$((i-1)).$DOMAIN:$SERVER_PORT:$ELECTION_PORT" >> /conf/zoo.cfg;
              done &&
              chown -Rv zookeeper "$ZOO_DATA_DIR" "$ZOO_DATA_LOG_DIR" "$ZOO_LOG_DIR" "$ZOO_CONF_DIR" &&
              zkServer.sh start-foreground
          readinessProbe:
            exec:
              command:
                - bash
                - -c
                - "OK=$(echo ruok | nc 127.0.0.1 2181); if [[ \"$OK\" == \"imok\" ]]; then exit 0; else exit 1; fi"
            initialDelaySeconds: 10
            timeoutSeconds: 5
          livenessProbe:
            exec:
              command:
                - bash
                - -c
                - "OK=$(echo ruok | nc 127.0.0.1 2181); if [[ \"$OK\" == \"imok\" ]]; then exit 0; else exit 1; fi"
            initialDelaySeconds: 10
            timeoutSeconds: 5
          volumeMounts:
            - name: data-volume-ch
              mountPath: /var/lib/zookeeper
      # Run as a non-privileged user
      securityContext:
        runAsUser: 1000
        fsGroup: 1000
  volumeClaimTemplates:
    - metadata:
        name: data-volume-ch
      spec:
        accessModes:
          - ReadWriteOnce
        resources:
          requests:
            storage: 20Gi
To deploy this manifest we will create another script:
#!/bin/bash

ZK_NAMESPACE="${ZK_NAMESPACE:-ch-zookeeper}"

CUR_DIR="$(cd "$(dirname "${BASH_SOURCE[0]}")" >/dev/null 2>&1 && pwd)"

kubectl create namespace "${ZK_NAMESPACE}"
kubectl --namespace="${ZK_NAMESPACE}" apply -f "${CUR_DIR}/zookeeper-1-nodes.yaml"Save this file as create-zookeeper-1-nodes.sh . The script will take care of creating a namespace (in our case ch-zookeeper) and apply this manifest there. Simply run the following in the directory of the file:
./create-zookeeper-1-nodes.sh
2.2) Check the Zookeeper Cluster
If the pod status is running, the Zookeeper deployment is successful. The status of the pods can be viewed through the following command:
kubectl get all -n ch-zookeeper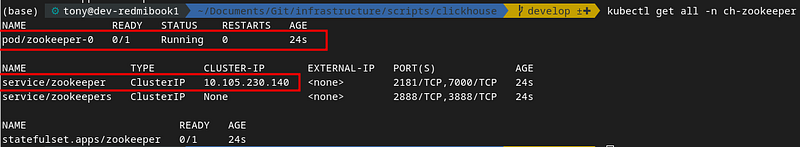
You will see a Service and a Pod for the Zookeeper. The importance of these two is not very evident with just one Zookeeper pod; but imagine having a 3 node cluster, you can use the Service host and port and Kubernetes will take care of redirecting you to any available Zookeeper pod in the cluster.
2.3) Deploy the clickhouse cluster
Having the ClickHouse Operator & Zookeeper Cluster up and running the next step is to define the ClickHouse Cluster Installation. This is defined in the clickhouse-cluster.yaml. Some important parts to note are in bold below (since most of the configuration is handled by the operator):
apiVersion: "clickhouse.altinity.com/v1"
kind: "ClickHouseInstallation"
metadata:
  name: "medium"
spec:
  # Templates are specified for all clusters ... if you want explicitly for each cluster then apply below
  defaults:
    templates:
      podTemplate: clickhouse
      dataVolumeClaimTemplate: data-volume-clickhouse
      logVolumeClaimTemplate: data-volume-clickhouse
  configuration:
    clusters:
      - name: "medium-cluster"
        layout:
          shardsCount: 2
          replicasCount: 2
    zookeeper:
      nodes:
        - host: zookeeper.ch-zookeeper
          port: 2181
  templates:
    podTemplates:
      - name: clickhouse
        spec:
          securityContext:
            runAsUser: 101
            runAsGroup: 101
            fsGroup: 101
          containers:
            - name: clickhouse
              image: yandex/clickhouse-server:21.10
              ports:
                - name: http
                  containerPort: 8123
                - name: client
                  containerPort: 9000
                - name: interserver
                  containerPort: 9009
              volumeMounts:
                - name: data-volume-clickhouse
                  mountPath: /var/lib/clickhouse
                - name: data-volume-clickhouse
                  mountPath: /var/log/clickhouse-server
    volumeClaimTemplates:
      - name: data-volume-clickhouse
        reclaimPolicy: Retain
        spec:
          accessModes:
            - ReadWriteOnce
          resources:
            requests:
              storage: 150Gi
The name medium will be the installation name. While the name medium-cluster is the name of the cluster within the installation. We can have multiple clusters but only 1 installation. The number of shards and replicas for that cluster is defined by shardsCount and replicasCount. We also need to specify the endpoints of the zookeeper we just created zookeeper.ch-zookeeper:2181.
Running the ./create-clickhouse-cluster.sh will create a number of servers to access those ClickHouse pods as well, but the most important one would be the LoadBalancer services which will take care of redirecting you to the appropriate shard, rather than you specifying which shard. Again we define the create-clickhouse-cluster.sh file:
#!/bin/bash

CH_NAMESPACE="${CH_NAMESPACE:-clickhouse-operator}"

CUR_DIR="$(cd "$(dirname "${BASH_SOURCE[0]}")" >/dev/null 2>&1 && pwd)"

kubectl create namespace "${CH_NAMESPACE}"

kubectl apply -n "${CH_NAMESPACE}" -f "${CUR_DIR}/clickhouse-cluster.yaml"
Run the script
./create-clickhouse-cluster.sh2.4) Check the Clickhouse Cluster
If the pod shards (0–0–0 and 1–0–0) and the respective replicas (0–1–0 and 1–1–0) status is running, the ClickHouse Cluster deployment is successful. The status of the pods can be viewed through the following command:
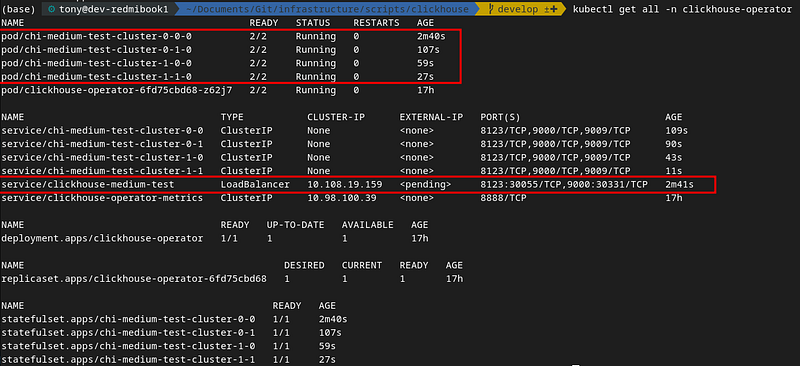
Each pod will be associated with a service so you can access that shard/replica directly. The most important one from the services when you have a replicated and distributed cluster is the LoadBalancer, so you are directed to less heavily loaded and readily available ClickHouse pods.
2.5) Connect to the cluster
Since we are trying to access the LoadBalancer service outside of the Kubernetes cluster we need to perform port forwarding:
kubectl port-forward svc/clickhouse-medium-test 8123:8123 — namespace clickhouse-operatorThis command essentially redirects any commands from localhost:8123 to http://clickhouse-medium-test.clickhouse-operator.svc.cluster.local:8123
Now you can use any IDE (DBeaver is a free solution) or even the clickhouse-client to access your cluster. In my case, I am a big fan of DataGrip:
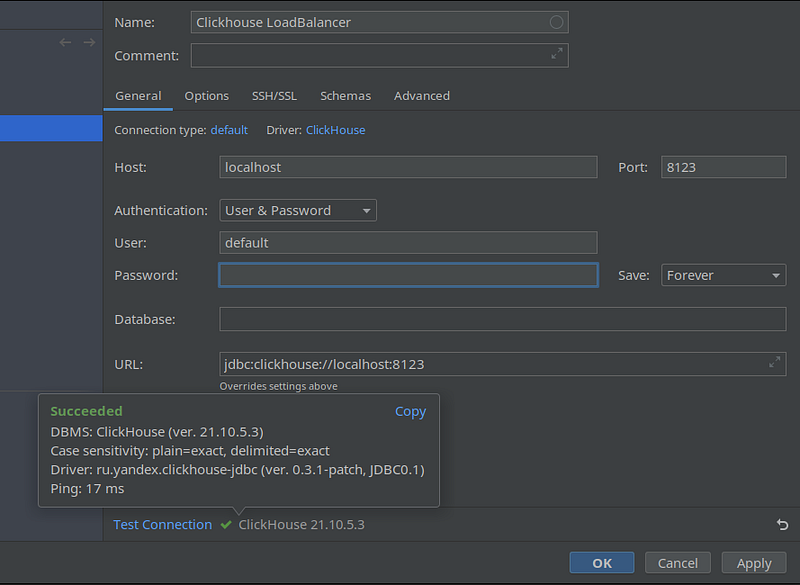
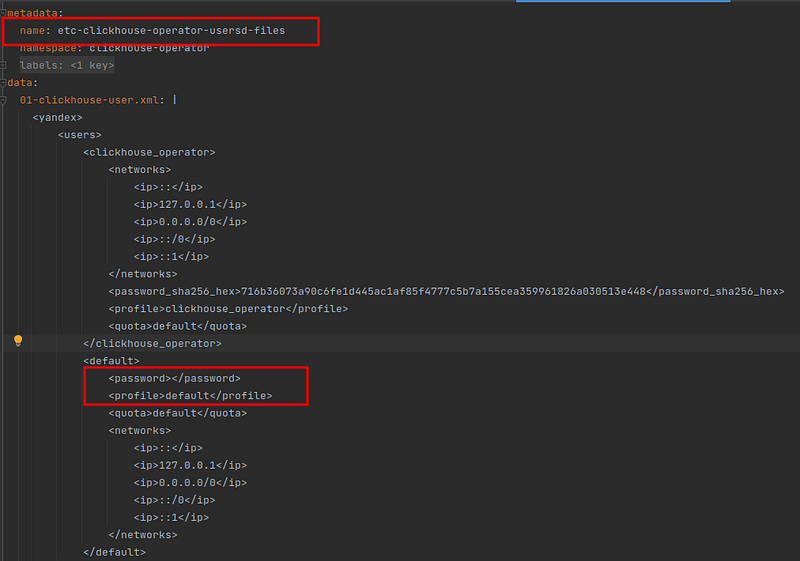
Note that for test purposes the username and password were set as default and null password respectively. Make sure to change those from inside the clickhouse operator yaml config:
2.6) Built-in macros
The Clickhouse Operator provides a set of macros, which are:
{installation}-- ClickHouse Installation name{cluster}-- primary cluster name{replica}-- replica name in the cluster, maps to pod service name{shard}-- shard id
ClickHouse also supports internal macros {database} and {table} that maps to the current database and table respectively.
The following code shows the macro automatically created by the current cluster, which we can use when creating a table.
<yandex>
    <macros>
        <installation>medium-test</installation>
        <all-sharded-shard>0</all-sharded-shard>
        <cluster>medium-cluster</cluster>
        <shard>0</shard>
        <replica>chi-medium-test-medium-cluster-0-0</replica>
    </macros>
</yandex>
3) Test the cluster
Since you are connected to the cluster, let's run some commands and view the output.
3.1) Create a set of tables
CREATE TABLE events_local on cluster '{cluster}' (
    event_date  Date,
    event_type  Int32,
    article_id  Int32,
    title       String
) engine=ReplicatedMergeTree('/clickhouse/{installation}/{cluster}/tables/{shard}/{database}/{table}', '{replica}', event_date, (event_type, article_id), 8192);
CREATE TABLE events on cluster '{cluster}' AS events_local
ENGINE = Distributed('{cluster}', default, events_local, rand());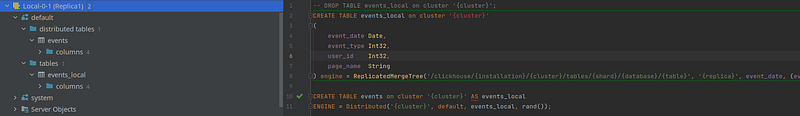
3.2) Insert data
INSERT INTO events SELECT today(), rand()%3, number, 'my title' FROM numbers(100);3.3) View data
SELECT count() FROM events;
SELECT count() FROM events_local;
SELECT * FROM events;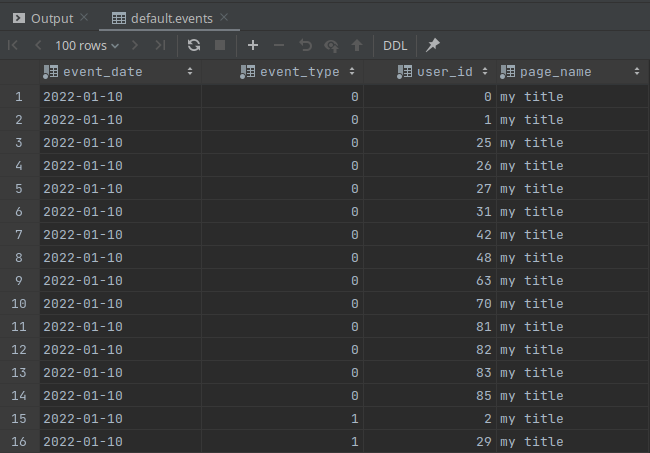
You will notice that the count in events_local is lower than events and that’s because the cluster is taking care of distributing data to the other shards. So always make sure to query the events table since that’s the distributed Engine that will take care to join the data from all shards
4) Check Local Persistent Volume
The yaml configuration above for the Zookeeper & ClickHouse Installation also creates persistent volume. This is needed to make sure data is independent of the life-cycle of the pod that uses it, meaning that even if the pod shuts down, the data in the volume is not erased. You can check those by running:
kubectl get pv — sort-by=.spec.capacity.storage
5) cluster monitoring
There are many ways to monitor a Kubernetes deployment but the two best opensource options I found useful for me are Prometheus & Grafana
5.1) Prometheus
I will be creating a separate article for Prometheus but in summary, the ClickHouse Operator creates a metrics service. Prometheus can use this address to grab metrics:
http://clickhouse-operator-metrics.clickhouse-operator.svc.cluster.local:8888/metrics5.2) Grafana Dashboard
With the Prometheus and ClickHouse Cluster set up, we can have a combination of dashboards to monitor the environment. Another separate article will be created for Grafana.
6) Conclusion
The ClickHouse operator is simple to install and can handle life-cycle operations for many ClickHouse installations running in a single Kubernetes cluster. It is designed for use cases ranging from quick tests to production data warehouses. So if it’s not clear from the above in summary the operator handles the following tasks:
- Setting up ClickHouse installations
- Changing the configuration of nodes, for example, to increase memory
- Adding and removing shards
- Adding and removing replicas
- Upgrading cluster nodes
- Monitoring cluster status
- Removing ClickHouse installations
- Provides Cluster Metrics for monitoring purposes
Altinity are also working on a Dashboard for the ClickHouse Operator that aims to make ClickHouse deployment in Kubernetes easy, painless, and successful. I recommend looking into this as well:


