
Data Visualization: List of 34 Common Types of Plots and Charts

Here’s a comprehensive list of common types of plots and charts used in data visualization. Each type of plot serves different purposes and is suitable for visualizing specific types of data or relationships:
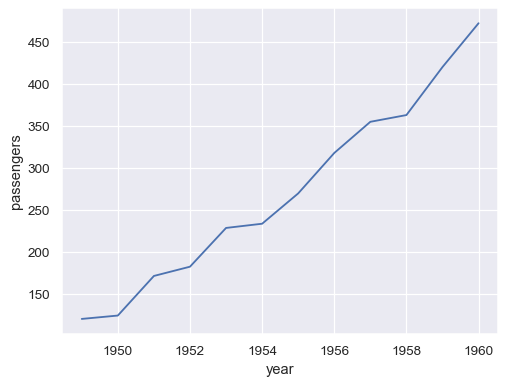
1. Line Plot:
Display trends over time or relationships between two continuous variables.
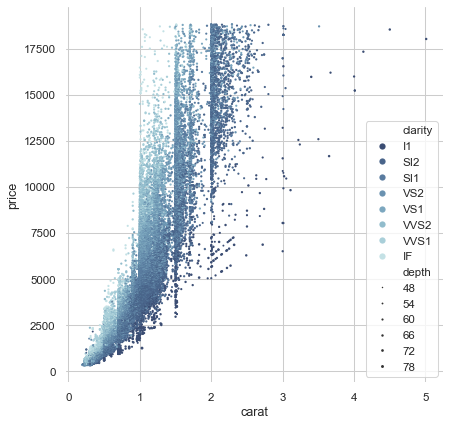
2. Scatter Plot:
Visualize the relationship between two continuous variables.
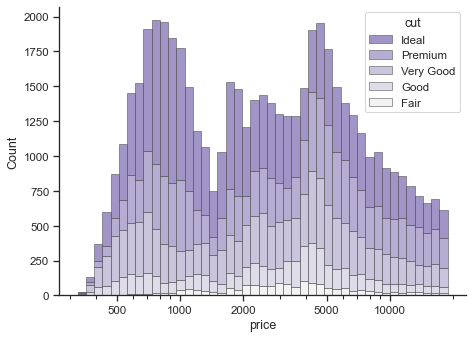
3. Histogram:
Show the distribution of a single numerical variable.
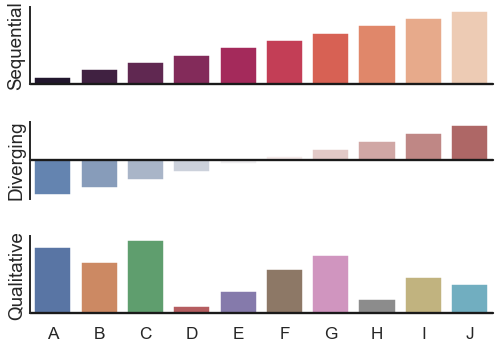
4. Bar Plot:
Compare the values of different categories or show the distribution of a categorical variable.
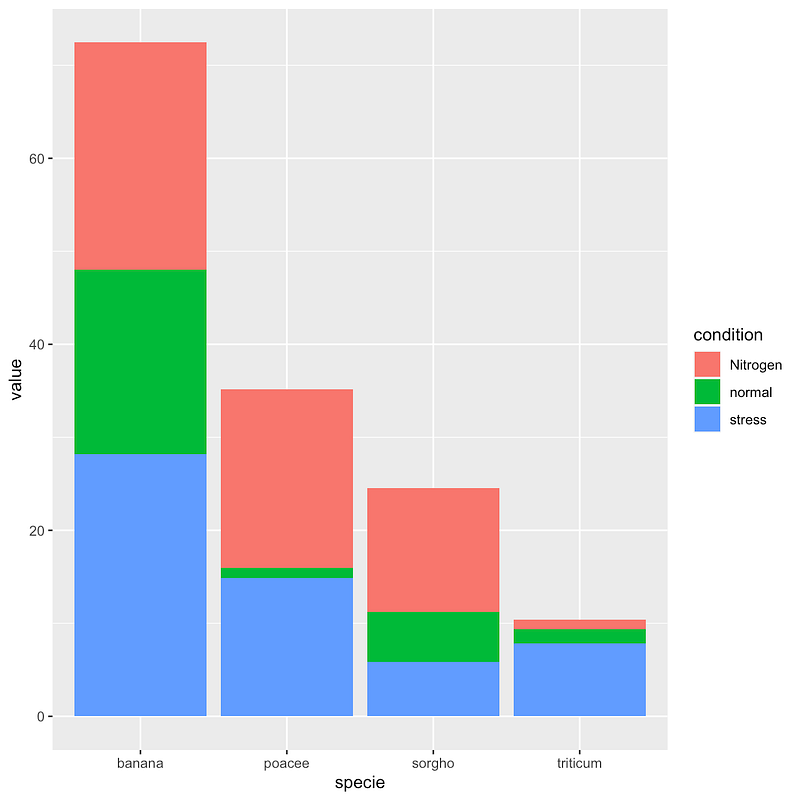
5. Stacked Bar Plot:
Display the composition of a category by stacking subcategories.
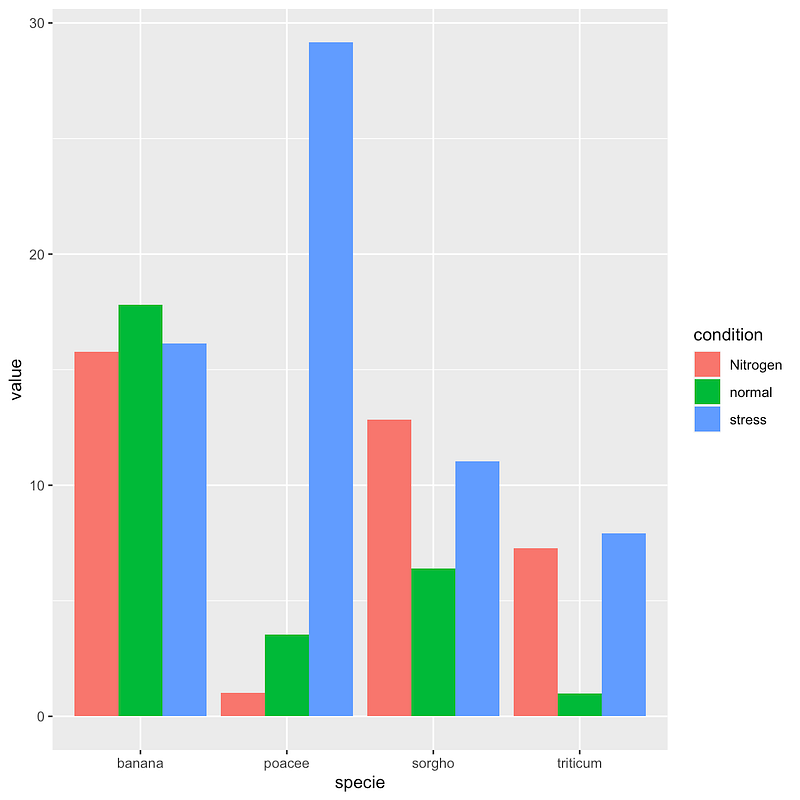
6. Grouped Bar Plot:
Compare values across multiple categories with grouped bars.
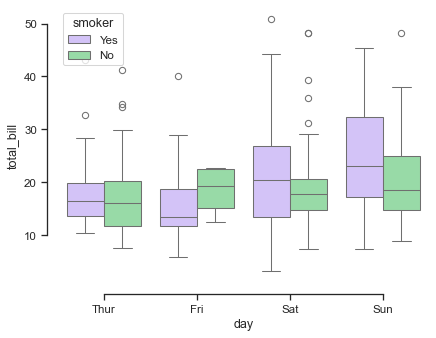
7. Box Plot (Box-and-Whisker Plot):
Illustrate the summary statistics of a numerical variable, including median, quartiles, and outliers.
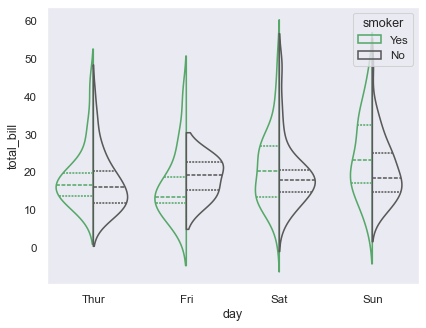
8. Violin Plot:
Combine a box plot with a kernel density estimation to show the distribution of a numerical variable.
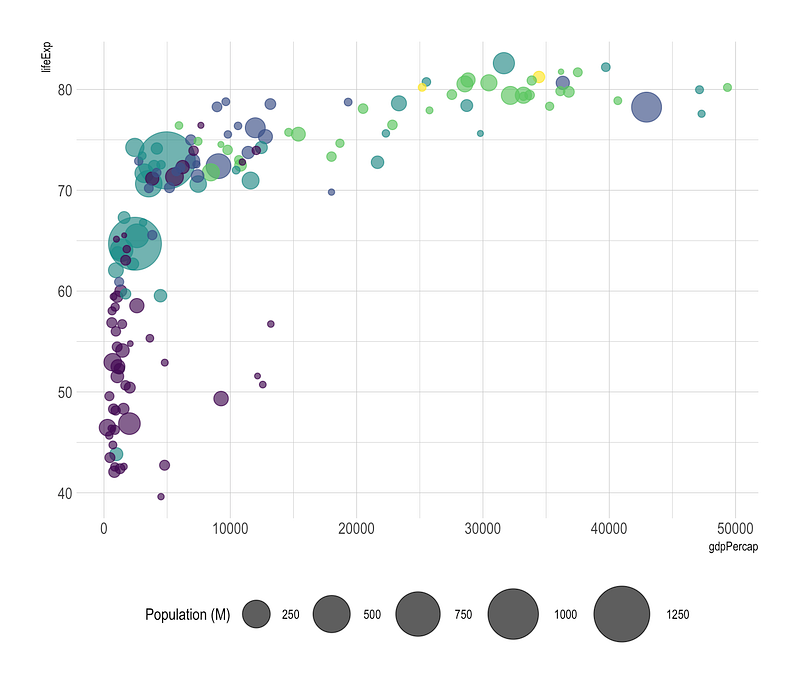
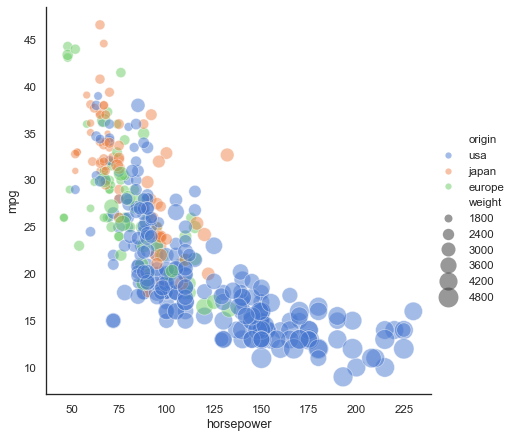
9. Bubble Plot:
Represent data points using circles, where the size of the circle indicates a third variable.
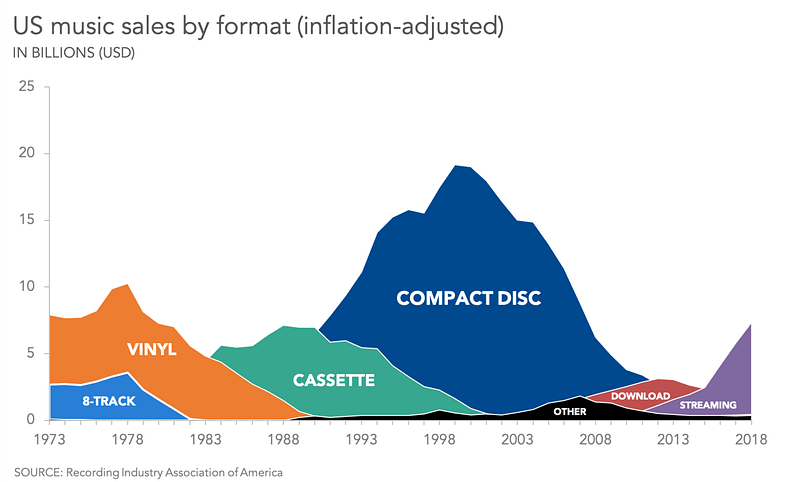
10. Area Plot:
Show the cumulative contribution of multiple variables over a continuous range.
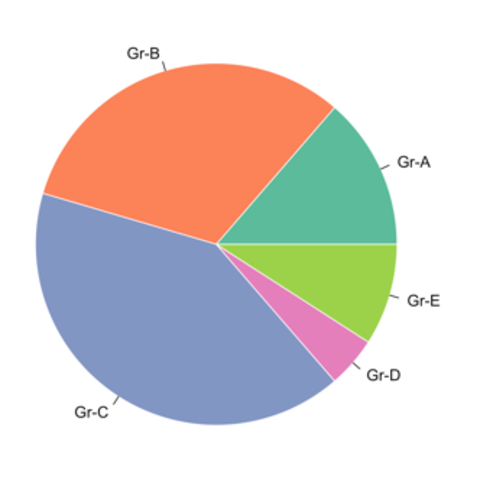
11. Pie Chart:
Display the proportion of different categories in a whole.
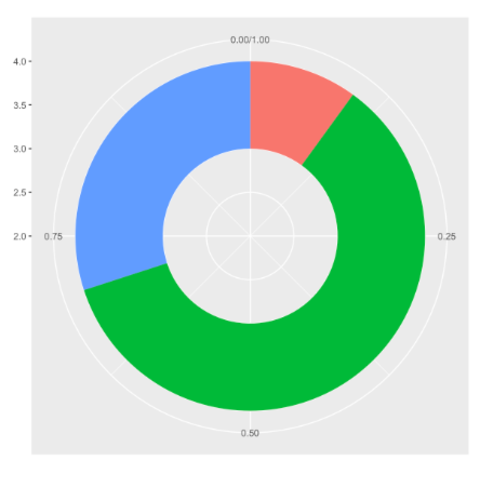
12. Donut Chart:
Similar to a pie chart but with a hole in the center.
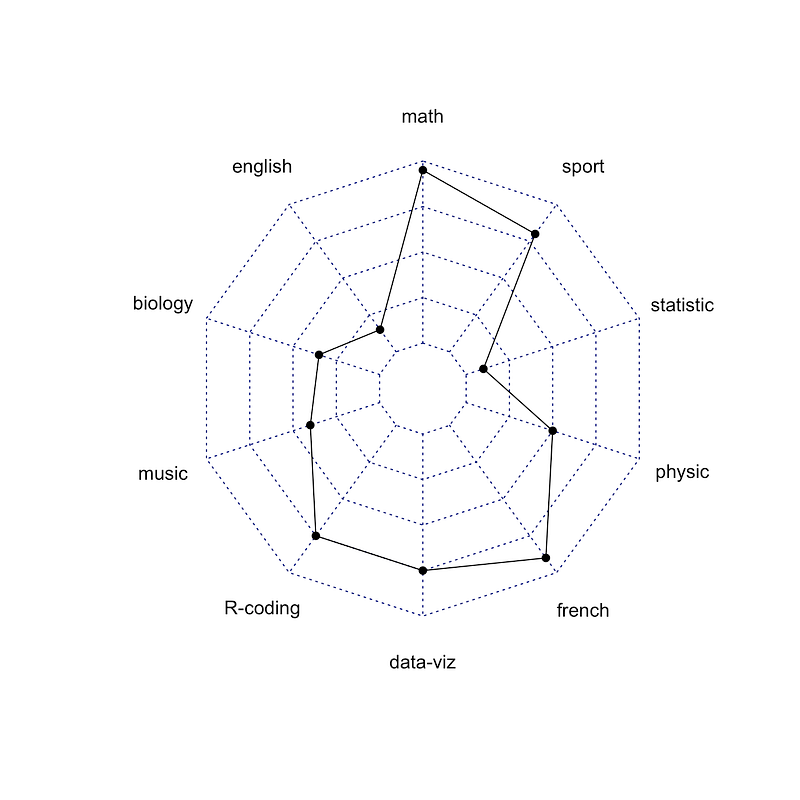
13. Radar Chart (Spider Plot):
Display multivariate data in the form of a two-dimensional chart.
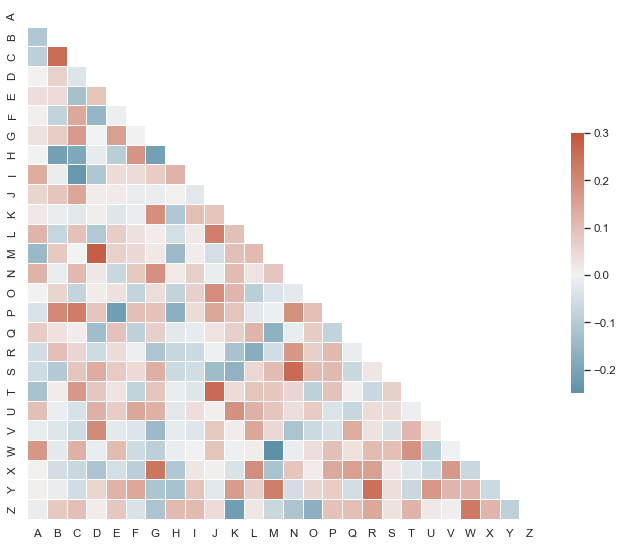
14. Heatmap:
Visualize the intensity of data values in a matrix with colors.
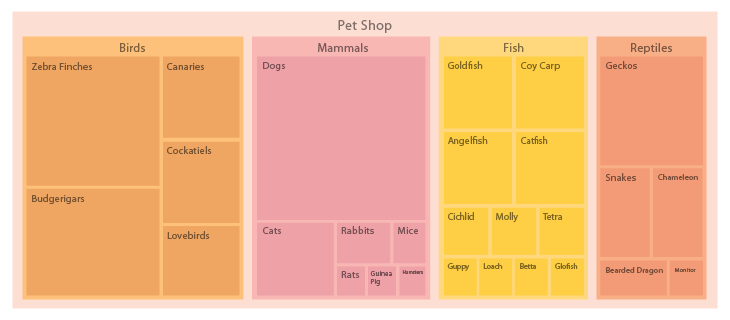
15. Treemap:
Represent hierarchical data structures using nested rectangles.
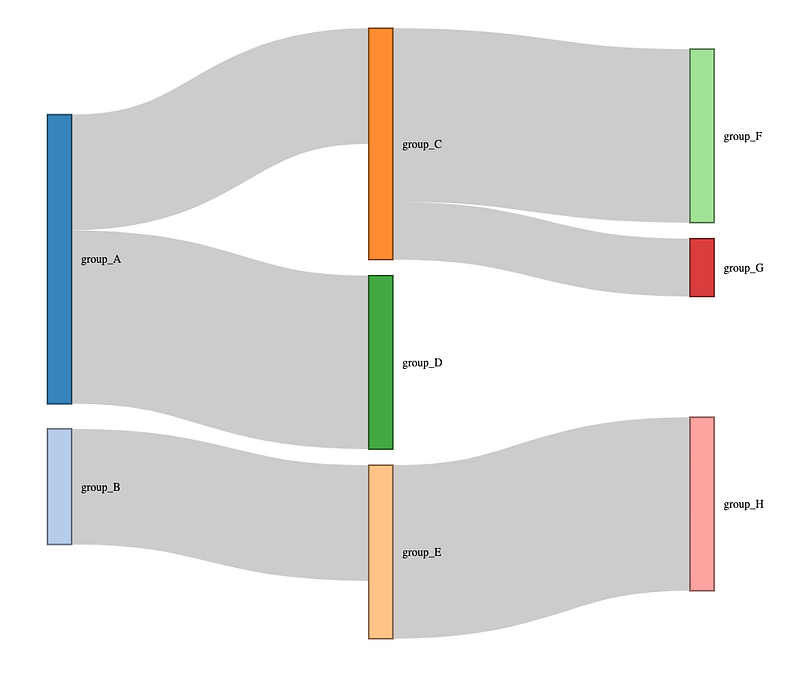
16. Sankey Diagram:
Display the flow of values or relationships between entities.
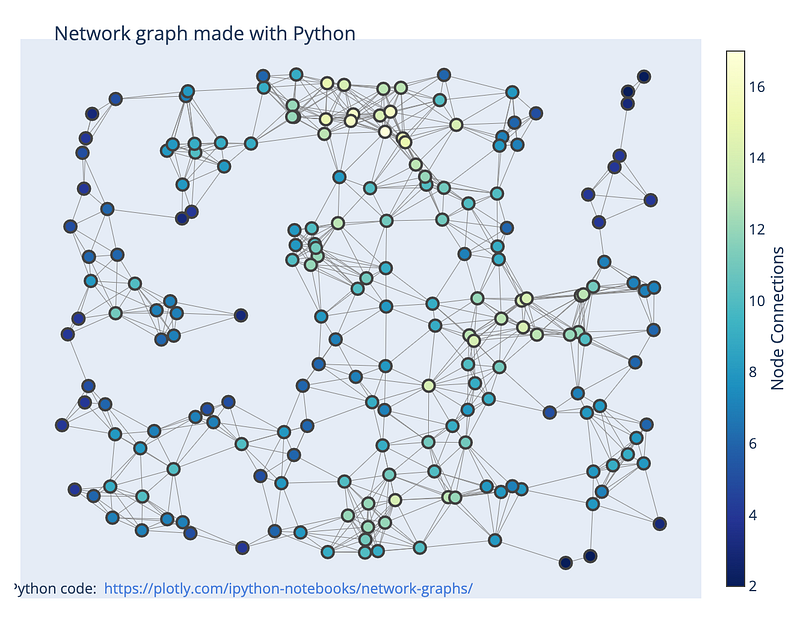
17. Network Graph:
Illustrate relationships and connections between entities.
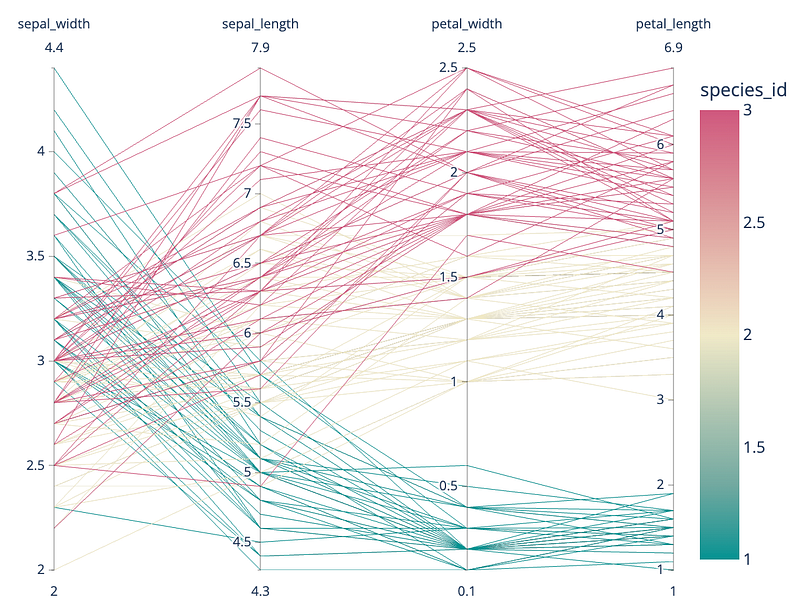
18. Parallel Coordinates Plot:
Visualize multivariate data in a parallel coordinate system.
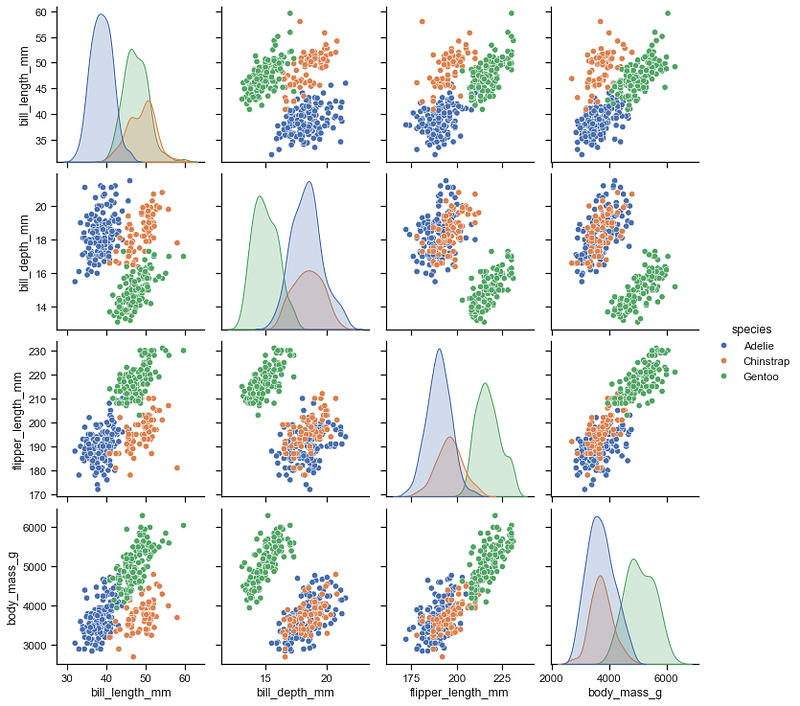
19. Scatter Matrix (Pair Plot):
Display scatter plots for all pairs of numerical variables in a dataset.
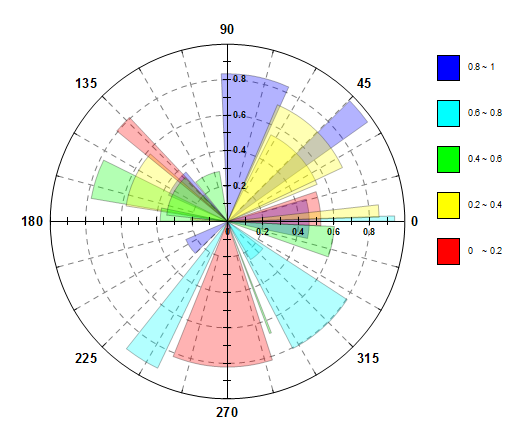
20. Polar Plot:
Display data in a circular format, suitable for cyclical patterns.
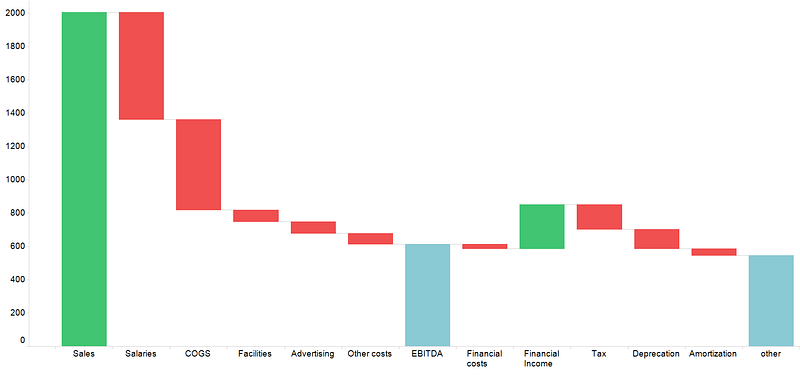
21. Waterfall Chart:
Illustrate the cumulative effect of sequentially introduced positive or negative values.
22. Word Cloud:
Visualize the frequency of words in a text dataset.

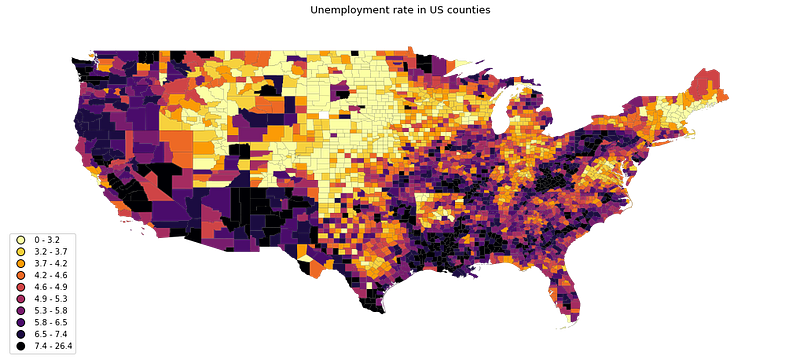
23. Choropleth Map:
Represent data values using colors on a geographical map.
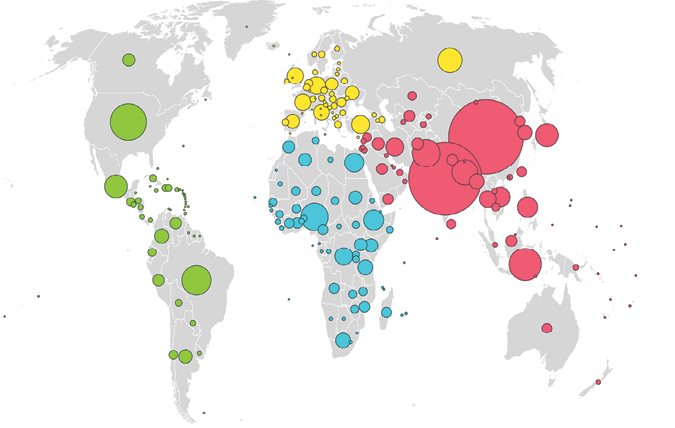
24. Bubble Map:
Similar to a bubble plot but on a geographical map.
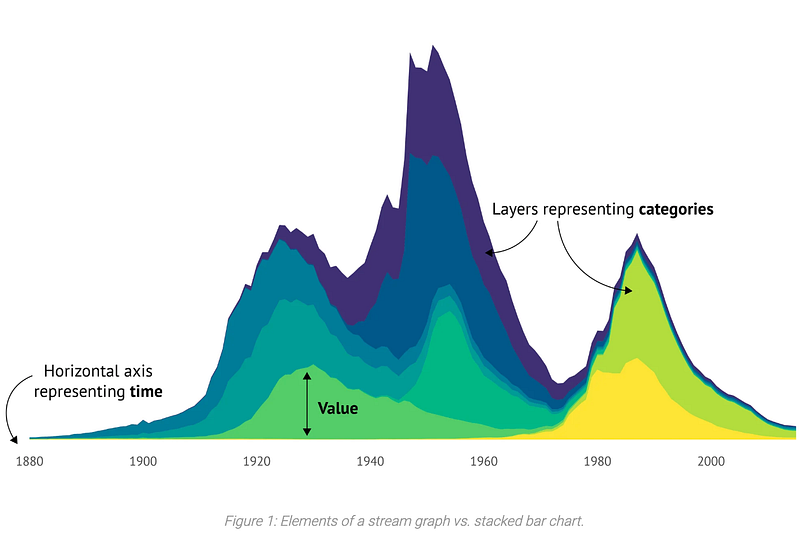
25. Streamgraph:
Display the evolution of multiple quantitative variables over time.
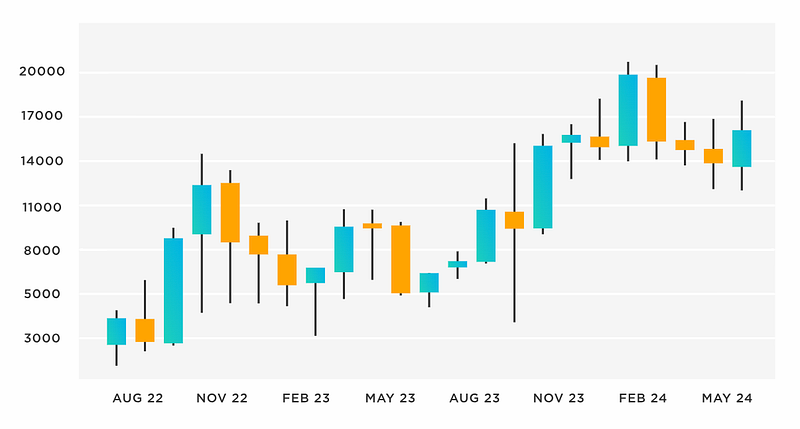
26. Candlestick Chart:
Used in financial analysis to represent the high, low, open, and close prices of a security over time.
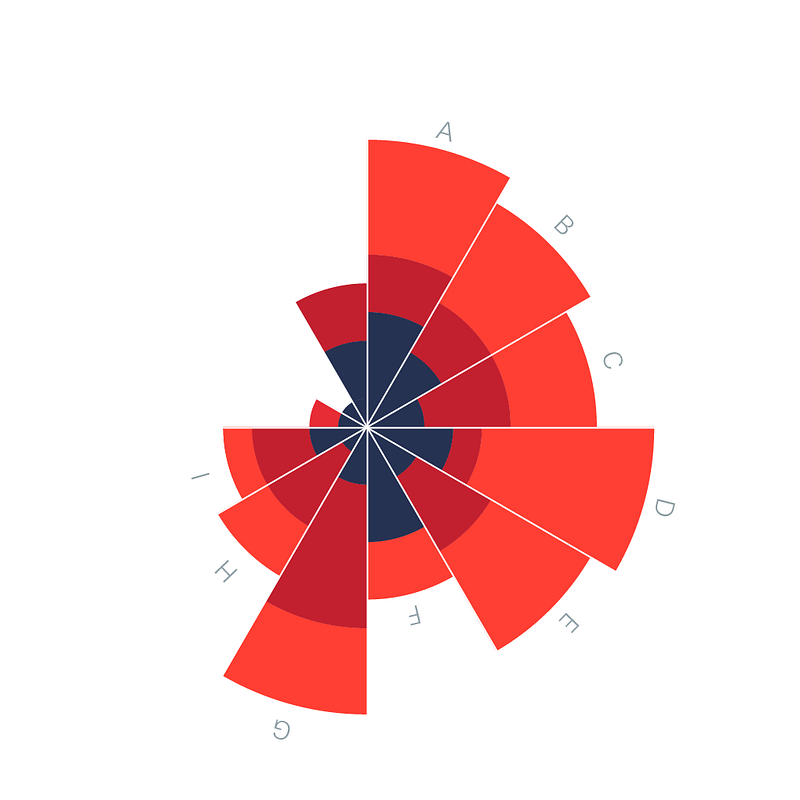
27. Polar Area Chart:
A variation of a pie chart where each slice is represented as a sector in a polar coordinate system.
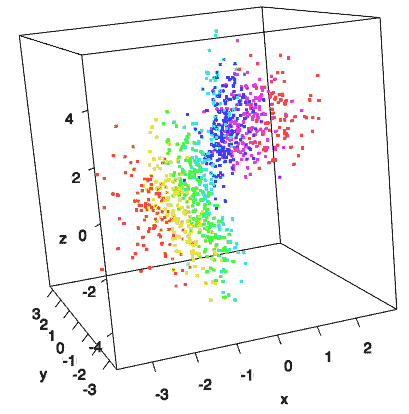
28. 3D Plot:
Represent data in three-dimensional space.
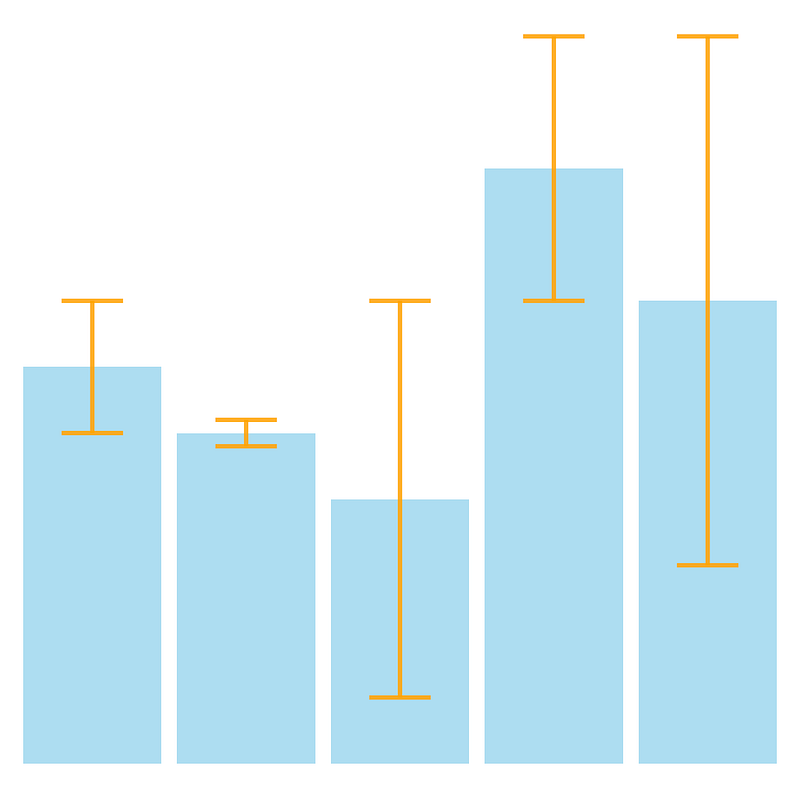
29. Error Bars:
Indicate variability or uncertainty in data points.
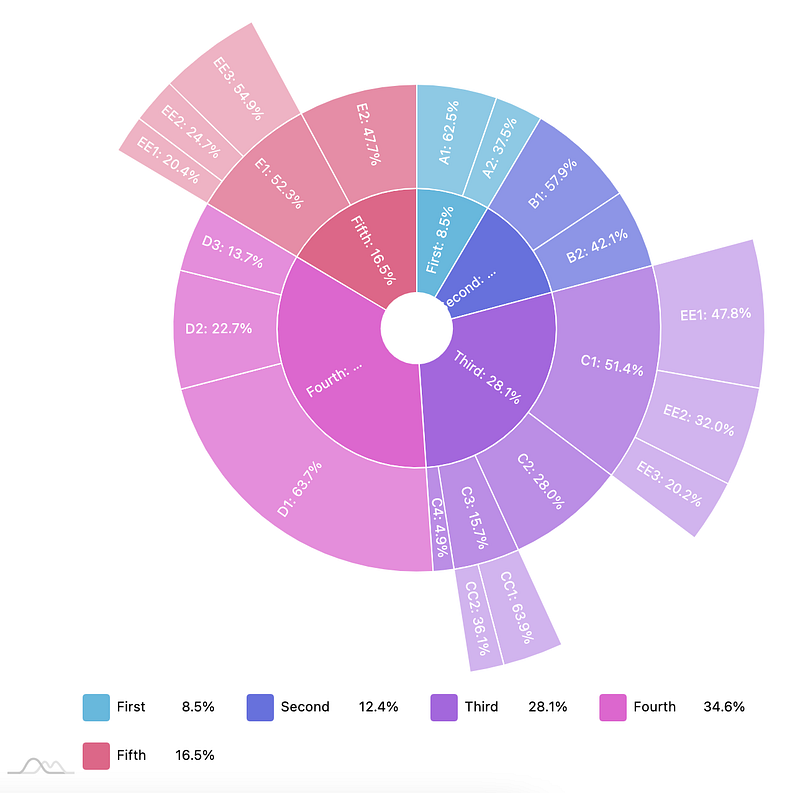
30. Sunburst Chart:
Display hierarchical data in a radial layout.
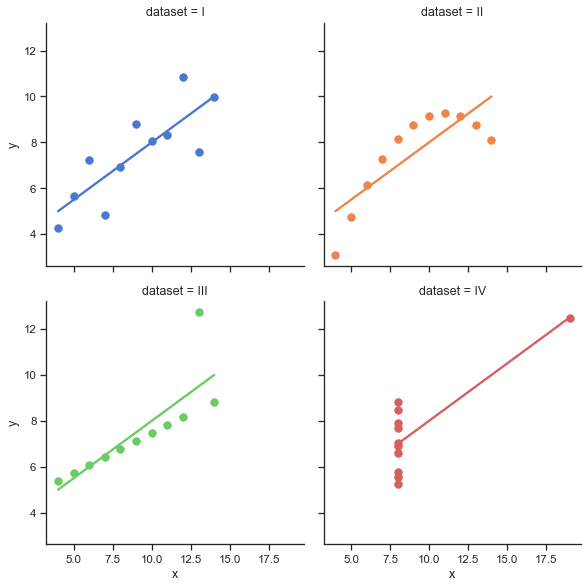
31. lm Plot:
Regression plot to visualize a linear relationship between different variables by plotting a regression line
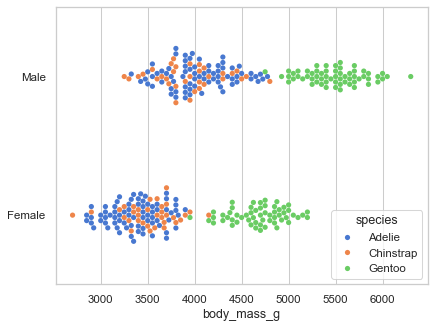
32. Swarm Plot:
Is a scatterplot when one variable is categorical, used in conjunction with boxplot to visualize individual data points and how they are distributed within a category.
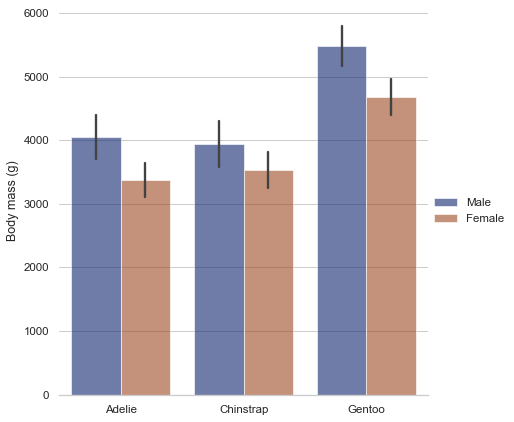
33. Cat Plot:
Categorical plot to visualize the relationships between variables
34. Rel Plot:
Relational plot to show the relationship between different variables with a semantic mappins of subsets
This list covers a wide range of plots used for different data visualization scenarios. The choice of plot depends on the nature of your data, the relationships you want to highlight, and the insights you aim to communicate.