
Data Modeling with Postgres
Introduction
This is the first project in Data Engineering Nanodegree. For this project, we have a music streaming startup called Sparkify who wants to analyze the data they’ve been collecting on their app regarding:
- songs
- user activity
This data currently resides in two directories:
Our task is to model user activity data to create a Postgres database optimized for song play analysis. We will do this by creating a database schema and ETL pipeline.
To follow along in upcoming sections, please follow its GitHub repo for instructions.
What is Data Modeling?
Data modeling is a high level abstraction that organizes data and how they relate to each other. — Wikipedia
Ever planned a trip or recorded payments in an Excel sheet? That is data modeling. Think about the process you went through when creating the first few rows. You decided what columns to keep. Maybe the number of columns changed when you recorded more observations and thought of another important feature. But you follow certain rules when creating the Excel sheet.
Same is the case with databases. In database design, what you record will eventually end up as a database for an information system. So, data modeling is also called database modeling.
Here we will be performing data modeling in Postgres for Sparkify. We start with creating facts and dimension tables for a star schema. We will use the files in song_data and log_data directories for it.
Data
The data used in this project will be used for upcoming projects also. So, it is better to understand what it represents.
Song Dataset
The first dataset is a subset of real data from the Million Song Dataset. Each file is in JSON format and contains metadata about a song and the artist of that song. The files are partitioned by the first three letters of each song’s track ID. For example, here are file paths to two files in this dataset.
And below is an example of what a single song file, TRAABJL12903CDCF1A.json, looks like.
Log Dataset
The second dataset consists of log files in JSON format generated by this event simulator based on the songs in the dataset above. These simulate app activity logs from Sparkify app based on specified configurations.
The log files in the dataset we’ll be working with are partitioned by year and month. For example, here are file paths to two files in this dataset.
And below is an example of what the data in a log file, 2018–11–12-events.json, looks like.
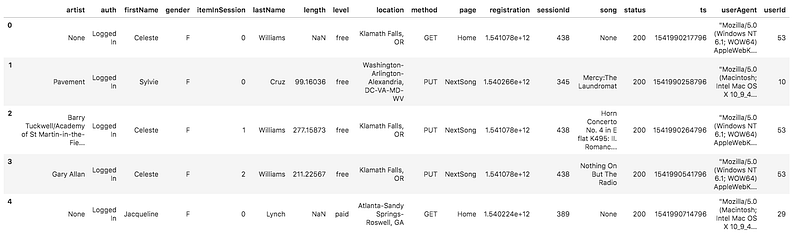
If you would like to preview the JSON data within log_data directory, you will need to create a Pandas df to read the data.
Note: Make sure to set the argument
lines = Trueinpd.read_json(). This will read every line of the JSON as a new row.
Schema for Song Play Analysis
Using the song and log datasets, we’ll create a star schema optimized for queries on song play analysis. But first let discuss in brief about star schema.
Star Schema
A star schema is the simplest style of data mart schema. The star schema consists of one or more fact tables referencing to any number of dimension tables. It has some advantages like fast aggregation for analytics, simple queries for JOINs, etc.
This includes the following tables:
Facts Table:
In data warehousing, a fact table consists of measurements, metrics or facts of a business process — Wikipedia
- songplays — records in log data associated with song plays, i.e., records with page
NextSong. This filter for page column specifies that user has played a song, like clicked on the nextsong button in the app.
- songplay_id, start_time, user_id, level, song_id, artist_id, session_id, location, user_agent
Dimension Tables
A dimension table is a structure that categorizes facts and measures in order to enable users to answer business questions. Commonly used dimensions are people, products, place and time. — Wikipedia
- users — Following information about users:
- user_id, first_name, last_name, gender, level
2. songs — Following info about songs:
- song_id, title, artist_id, year, duration
3. artists — Artists information:
- artist_id, name, location, latitude, longitude
4. time — Timestamp broken down into specific units:
- start_time, hour, day, week, month, year, weekday
In order to create these tables, all we need to do is perform some transformation in the data which are already in song_data and log_data directory.
Process song data (song_data directory)
We will perform ETL on the files in song_data directory to create two dimensional tables: songs table and artists table.
This is what a songs file looks like:
For songs table, we’ll extract data for songs table by using only the columns corresponding to the songs table suggested in the star schema above. Similarly, we’ll select the appropriate columns for artists table.
Now insert the extract data into their respective tables.
Variables song_table_insert and artist_table_insert are SQL queries. These are given in sql_queries.py file.
Process log data (log_data directory)
We will perform ETL on the files in log_data directory to create the remaining two dimensional tables: time and users, as well as the songplays fact table.
This is what a single log file looks like:
For time table we have ts column in log files. We will parse it as a time stamp and use python’s datetime functions to create the remaining columns required for the table mentioned in the above schema.
For users table, we’ll extract the appropriate columns from log files as mentioned in the star schema above for users table.
For songplays table, we will require information from songs table, artists table and the original log files. Since the log files do not have song_id and artist_id, we need to use songs table and artists table for that. The song_select query finds the song_id and artist_id based on the title, artist_name, and duration of a song. For the remaining columns, we can select them from the log files.
Now insert the data into their respective tables.
Conclusion
That’s it. We created a Postgres database with the facts and dimension table for song_play analysis. We populated it with the entries from songs and events directory. Now our data is useful for some basic aggregation and analytics.
In the next blog, I will be discussing data modeling in Apache Cassandra — A NoSQL DBMS.


