
Data Flow Diagrams: A Visual Representation of Information Flow
Let me tell you why I love Data Flow Diagrams so much!!

Hello fellow BAs, and Welcome Back for another technique in the series Business Analysis Techniques.
What are Data Flow Diagrams (DFDs)?
So Why I love Data Flow Diagrams? Because DFDs are awesome, that’s why!
They allow us to visualize and analyse the data flow within a system. They help us to understand how information moves from one process to another, what inputs and outputs are involved, and where data is stored or exchanged. They also help us to communicate with stakeholders by providing a common visual language that everyone can understand.
DFDs are especially useful for transaction-based systems, where data is constantly being processed and shared between different components.
For example, think of an online shopping system, where customers place orders, products are shipped, payments are processed, and inventory is updated. A DFD can show how all these processes interact with each other and with external entities like customers, suppliers, banks, etc.
Levels of Data Flow Diagrams
DFDs can be developed at different levels of detail depending on the scope and complexity of the system being analyzed. This allows analysts to zoom in on specific areas for closer examination or zoom out for an overall view of the entire system.
The most common levels of DFDs are:
Context diagram
This is the highest level of DFD that shows the system as a single process with its interactions with external entities.
It provides a bird’s eye view of the system and its boundaries.
Level 0 diagram
This is the next level of DFD that shows the main processes within the system and how they interact with each other and with external entities.
It provides an overview of the system’s functionality and data flow.
Level 1 diagram
This is the next level of DFD that shows the sub-processes within each main process and how they interact with each other and with data stores.
It provides more details on the logic and operations of each process.
Level 2 diagram
This is the lowest level of DFD that shows the elementary processes within each sub-process and how they interact with each other and with data stores.
It provides the most details on the data flow and processing steps.
How to Draw the Data Flow Diagrams?
To create a DFD, business analysts need to follow a systematic process that involves the following steps:
1. Define the scope and boundaries of the system
This involves identifying the purpose, objectives, and scope of the system being analyzed, as well as its external entities and interfaces. This can help determine the level of detail and complexity required for the DFD.
2. Identify the processes within the system
This involves identifying the main activities or functions that the system performs, as well as their inputs and outputs. This can help determine the processes and data flows that need to be represented in the DFD.
3. Identify the data stores within the system
This involves identifying the repositories where information is stored or retrieved by the system, as well as their contents and formats. This can help determine the data stores that need to be represented in the DFD.
4. Draw the DFD using standard symbols and notations
This involves drawing the DFD using circles or rounded rectangles for processes, open-ended rectangles for data stores, squares or rectangles for external entities, and arrows for data flows. The DFD should be labeled with descriptive names for each component and data flow.
The DFD should also follow some basic rules, such as:
- Each process should have at least one input and one output data flow.
- Each data flow should have only one direction and one destination.
- Each data store should be connected to at least one process by a data flow.
- Each external entity should be connected to at least one process by a data flow.
So how do you actually draw a DFD? Well, it’s not that hard once you get the hang of it.
A DFD consists of four main components: processes, data stores, external entities, and data flows. Let me explain each one briefly:
Processes: These are activities or functions that transform input data into output data. They are represented by circles or rounded rectangles with descriptive names. For example, “Process Order” or “Ship Product”.
Data Stores: These are repositories where information is stored for later use. They are represented by open-ended rectangles with names like “Order Database” or “Inventory File”.
External Entities: These are sources or destinations of data outside the system being analyzed. They are represented by squares or rectangles with names like “Customer” or “Supplier”.
Data Flows: These are arrows that depict the movement of information between the other components. They have labels that describe the content and format of the data being transferred. For example, “Order Details” or “Payment Confirmation”.
By using symbols and arrows to illustrate these elements and their relationships, DFDs offer a clear and concise way to map out complex systems.
5. Validate and verify the DFD
This involves checking the accuracy, completeness, and consistency of the DFD by comparing it with the system’s requirements, specifications, and functionalities. This can help identify any errors, gaps, or ambiguities in the DFD and make necessary corrections or improvements.
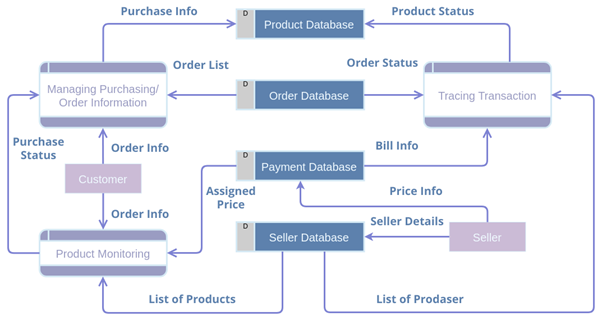
Here’s an example of a simple DFD for an online shopping system:
Now, you may be wondering: How much detail should we include in the DFD?
Well, that depends on the scope and complexity of the system being analyzed. You can create DFDs at different levels of detail depending on your needs.
For example, you can start with a high-level overview of the system (also called a context diagram) that shows only the main processes and external entities. Then you can break down each process into sub-processes and show more details about the data flows and data stores. This is called leveling or decomposition.
The advantage of leveling is that it allows you to zoom in on specific areas for closer examination or zoom out for an overall view of the system. The disadvantage is that it can create too many diagrams that may be hard to manage or maintain.
A good practice is to limit the number of levels to three or four and use clear numbering or naming conventions to identify each diagram.
Strengths of Data Flow Diagrams Technique
Like any other technique, DFDs have their own strengths and weaknesses that business analysts should be aware of when using them.
Some of the strengths of DFDs are:
- They provide a clear and concise way to map out complex systems and hence they are easy to understand and interpret by both technical and non-technical people.
- They provide a high-level view of the system without getting into too much detail or complexity.
- They help identify potential bottlenecks or inefficiencies in how data is processed and shared
- They focus on what the system does rather than how it does it, which makes them suitable for analyzing different types of systems.
- They show how data is transformed from one state to another, which helps reveal errors or inconsistencies in data processing.
- They facilitate communication between stakeholders by providing a common visual language
Limitations of Data Flow Diagrams Technique
Some of the weaknesses of DFDs are:
- They do not provide any information on the timing or sequence of data flow or processes, which makes them unsuitable for analyzing real-time or dynamic systems.
- They do not show any control or decision logic within processes, which makes them unsuitable for analyzing conditional or branching scenarios.
- They do not show any physical or logical aspects of the system, such as hardware, software, network, or database components, which makes them unsuitable for analyzing technical or implementation issues.
- They can become cluttered or confusing when dealing with large or complex systems, which makes them difficult to maintain or update.
Real-Life Examples of Data Flow Diagrams Technique
DFDs serve as valuable tools for business analysts by providing insights into how information flows through different parts of a system. They help facilitate communication between stakeholders by providing a common visual language that everyone can understand.
But enough talk, let’s see some examples!
Analyzing Existing Systems
DFDs can help business analysts understand how current systems work, what data is involved, where it comes from, where it goes, and how it is transformed along the way. This can help identify problems, gaps, or opportunities for improvement in existing systems.
Designing New Systems
DFDs can help business analysts design new systems or modify existing ones by defining the requirements, specifications, and functionalities of the system. This can help ensure that the system meets the needs and expectations of the users and stakeholders.
Documenting Systems
DFDs can help business analysts document systems by providing a clear and concise representation of the system’s structure, behavior, and data flow. This can help create a shared understanding of the system among different parties involved in its development, maintenance, or use.
Online Shopping
A DFD can show how customers browse products, add items to their shopping cart, check out, pay, and receive confirmation emails. It can also show how the online store interacts with external entities such as payment gateways, shipping companies, inventory systems, etc.
Library Management
A DFD can show how library patrons borrow and return books, how librarians manage book records and inventory, how fines are calculated and collected, etc. It can also show how the library system interacts with external entities such as publishers, suppliers, etc.
Hotel Reservation
A DFD can show how customers search for available rooms, make reservations, cancel reservations, check in, check out, etc. It can also show how the hotel system interacts with external entities such as travel agencies, booking websites, etc.
So what are you waiting for? Grab a pen and paper (or your favorite diagramming software) and start drawing some DFDs! You’ll be amazed by what you can discover and achieve with these amazing diagrams!
Keep watching this space for more Business Analysis Techniques.
I hope you enjoyed this blog post about data flow diagrams (DFDs). If you did, please engage fully by sharing it with your friends and colleagues who might benefit from it, by clapping (50 claps), and share your views in comments or buy me a coffee. Also, don’t forget to follow and subscribe to me.
Until next time!!


