
Data and Social Media: Don’t Believe Everything You See

Social media has become a core part of our lives with apps like Facebook and Twitter. With the click of a button, we can instantly be connected to people around the world. Along with this connection comes the sharing of information.
Facebook has become a platform that people go to for news. It makes it easy to upload links and photos to spread news. The issue is, this news might be fake. Now more than ever, we must question the data behind all the memes and graphs shared through social media.
A recent study found that Facebook spreads fake news faster than any other social media site. Given that Facebook is the largest among the social media companies, that’s cringe worthy!
This issue has spread to all subjects. One of the worse is the spread of misinformation about COVID-19. It is so bad, WHO created a myth busters page. Healthcare officials are going to great lengths to prevent the spread of information because people are believing headlines on Facebook without fact checking them. Don’t be one of these people!
As a statistician teaching intro statistics courses, I always tell my students they must go beyond the headlines and graphs. Below, I will outline a few things that we have to ask before we believe any information.
#1: How Was The Data Collected?
If you’ve read my story on averages, then you know I’m always skeptical of how data is collected. Data collection is integral in deciding what types of conclusions we can draw from data and whether the data represent what we think it represents.
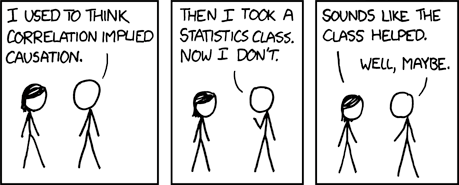
For example, all to often, people see two things that are correlated and assume one causes the other. Well, correlation is not causation. Unless we control for all other factors while collecting the data, we cannot make causation claims. This is the most prevalent issue with studies yet when you go on social media they make causation claims all the time.When you check the data collection method, nothing was controlled for. This means many things could have influenced the outcome.
Lets take a silly yet informative example.

Consider ice cream sales and crime in the summer. Ice cream sales increase in the summer. Crime also increases in the summer. That means these two things are correlated and increase together. Can we then make the claim that more ice cream sales cause more crime? Of course not! This would be silly. Obviously, there is more going on to these two things increases during summer. Ice cream sales more than likely increase due to it being hotter outside. The same is true for crimes. Thus, if we had controlled for weather, we would see these two things are no longer related. While this example is silly, it illustrates that two things being correlated does not mean one causes the other.
#2: Is The Data Real?
This is not a joke. You really need to question whether the data is real. Everybody cannot be trusted which is why it helps for people to try to replicate the study. Consider Michael Lacour, he published an amazing article on attitudes in the academic journal Science and it was shared everywhere. Then, it was found that he faked the results. If graduate students working toward degrees are willing to fake data, why would a random person on Facebook with nothing to lose not fake data?
Creating data and graphs is actually not that difficult. With today’s technology , we can create graphs almost instantly.
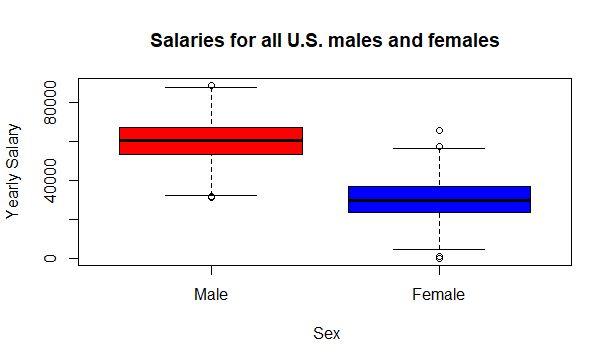
The photo above might look real, but I actually created that on my computer. It shows that males make roughly double what females make. It looks like the median salary for males is 60k and females is 30k. Since this is a hot topic and there is evidence in other places that males make more than females on average, this graphs fits that narrative. This makes it easy to believe if you do not question the data. Next, all I would need to do is write an article and make a claim. This is why you have to be careful! Just because they have a graph, does not mean it isn’t fabricated!
#3:Was The Sample Large Enough?
Many studies like to generalize their results to large populations while having small samples. The problem is small samples might not represent the population well. Take for example this study about Americans who moved due to COVID-19. The headline says about 1/5 of adults moved or knows someone who did.
When we look at the number of Americans sampled, it’s less than 10k. The US has 328 million people. Is it reasonable to generalize to 328 million people from only 10k?
Of course surveying every America is impossible given how much money it would cost but we still need a reasonable amount of people. 10k is so small of a sample that it should make you question whether the results are generalizable.
Sample size issues exist in more than studies about Americans. They exist in studies about behavior, politics, medicine,etc. They are just natural restrictions to getting large samples.
I hope by now you are skeptical of news you see on social media. You should always question everything about it from whether it is real to whether we can believe the claims in the articles. Do not get swayed by the titles of article. Get into the data instead.
If you enjoyed this, you might also like:


