
Data & Analytics Careers — How to Get to the Next Level in Your Journey.

In today’s Business Environment, there are two types of companies: those that understand their data and those in danger of going under. In 2020, 2.5 quintillion bytes of data are produced by humans every day¹. Also known as an Exabyte or 1 BILLION Terabytes.
Some examples of the data being generated includes:
- Search Queries
- Shopping Habits (both in-person and digital)
- GPS Location and other IoT Sensors
- Social Media Posts
- Individual Website Interactions
Companies are looking to build more in-depth analytics based on the data they can produce or buy. They need help aggregating the data and performing the analysis. According to Credence Research:
The global big data analytics market was valued at $37.34 Bn in 2019 and is projected to grow to $105.08 Bn, growing at a CAGR (Compounded Annual Growth Rate %) of 12.3% during the forecast period from 2019 to 2027.²
There are many jobs in this burgeoning industry, so let’s cover what methodologies and skills will be needed. But first things first.
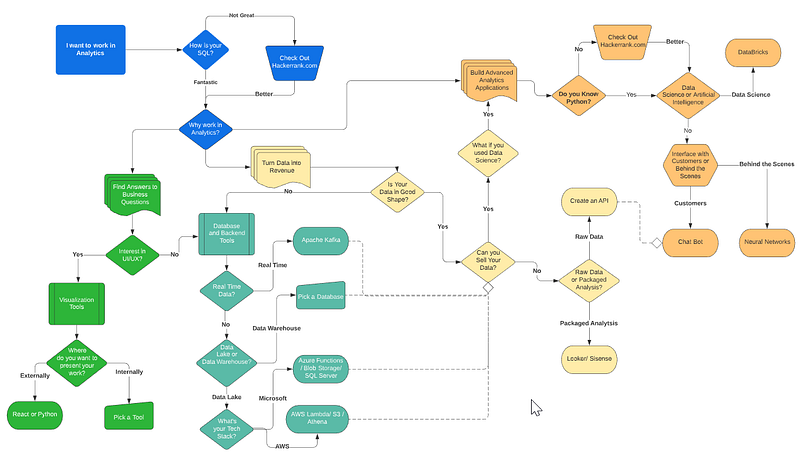
First Things First — Learn SQL
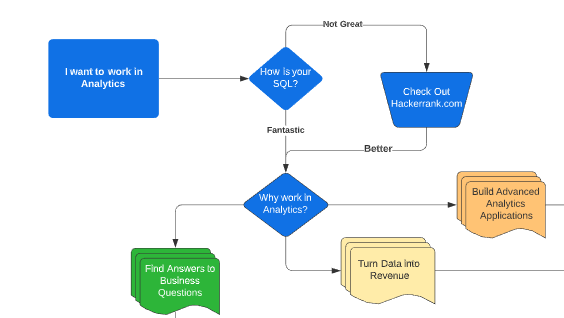
SQL (or Structured Query Language) is the basis of most of the tools in the Data and Analytics Space. Knowing this will give you a big leg up in the industry. If you’re not familiar with SQL, then head over to HackerRank and work through some of the exercises. The more SQL you know the better off you will be.
What interests me the most?
A significant amount of Data and Analytics work is currently done in Excel. This work results in increasingly complex workbooks. The next step is often building Tableau or Power BI visualizations based on that work.
The breadth of what you can do with Data and Analytics tools is vast. We are going to walk through three different applications of data and analytics tools. By focusing on a business application, you can find satisfaction as you grow in your career and skill set. As you progress through these tracks, try to determine which skills can be used in multiple situations.
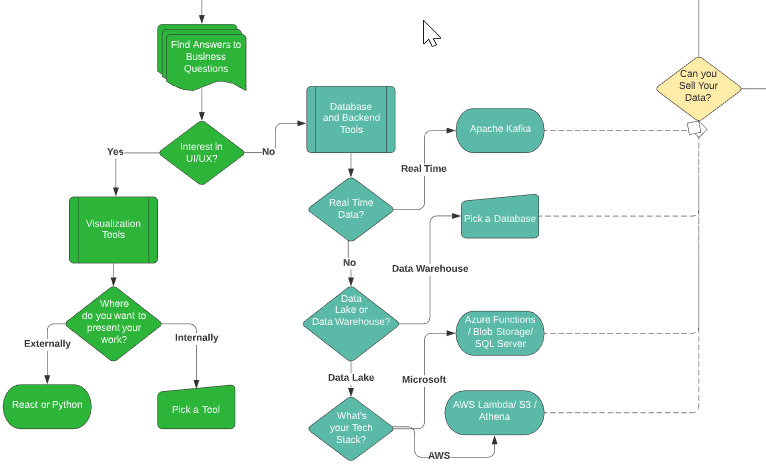
Track 1 — Find Answers to Business Questions
This is the track that Analytic Professionals often find themselves in.
There are two different paths within this track. Would you rather work with Visualizations and Delivering Answers (i.e., UI/UX) to users or finding answers in data without worrying about what graph you should be using?
Visualization Tools
Often which visualization tool is determined by your employer’s needs. If you want to present the data in web pages or custom applications, you should learn Python libraries like Plotly, Matplotlib, or Data Visualization Libraries for React (find more detailed analysis below from M. Ege Ercan).
If you need to present the visualizations or data internally, there are many tools specifically for that purpose. The largest players in the market are Tableau and Microsoft’s Power BI. I would also look at tools like Thoughtspot (Machine Learning enabled Analytics) or Looker (a recent Google Acquisition).
Database and Backend Tools
If you are more interested in coding and less interested in finding the right graph for your data, Database design will be the tools you will become familiar with. As we discussed above, SQL is a necessary skill to have. After you have mastered SQL, what you learn next is more dependent on what kind of data you need/have or how you will analyze/use it.
- Are you Streaming Real-Time Data? Apache Kafka is an excellent solution to learn as it is open source and widely used in the enterprise space.
- A Data Lake is a vast pool of raw data. If you want to build a Data Lake (i.e., you plan to have data from many different sources that you want to bring into one place), your decision is based more on what cloud platform you will use. While they all have their pros and cons, AWS, Microsoft Azure, and Google Cloud Platform all have similar components and will meet most needs
- A Data Warehouse is a structured, filtered, or aggregated data source and is easier for analysts to use. They can live in harmony (and often do). If you choose to become a Data Warehouse expert, try your hand at Snowflake, Single Store, or MySQL.
When building your skills in this space, it is important to ensure you are aware of the Cloud and the various offerings.
By 2022, public cloud services will be essential for 90% of data and analytics innovation.³
Your data architecture and the corresponding skills you will build depends on how your data architecture will be used. Whether you are primarily servicing analysts, supporting new applications, or feeding data to machine learning algorithms, building a data architecture is just the first step.
Building Data Architecture can be expensive and acquiring the skills in the discipline can be time-consuming. With that in mind, the work and capital that goes into building up those skills and architecture can be recouped when you:
Track 2 — Turn Data into Revenue
By 2022, 35% of large organizations will be either sellers or buyers of data via formal online data marketplaces, up from 25% in 2020.³
With more and more data being generated every day, the biggest question is not whether to sell your data but how to maximize your return. Data Monetization can take many shapes.
- You can sell data through an API or a data exchange like Snowflake’s Data Marketplace.
- You can build data applications and embed advanced visualization tools like Looker or Sisense.
- Finally, you can use the data coupled with Data Science to provide more insights.
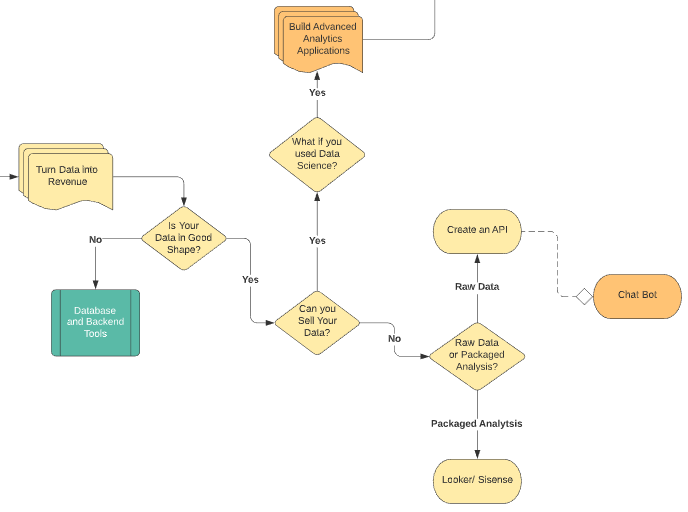
Before you start your journey down this track, you should ask yourself this questions: Is your data in good shape? If it isn’t, you probably want to go to the above section and re-examine your architecture.
There are many different opportunities in the Data Monetization space. When looking at Data Monetization opportunities, take an expansive approach. Try various opportunities. Build a few POCs before committing to one solution. Here’s a great article on how to approach that methodology:
Track 3 — Build Advanced Analytics Applications
There are a lot of buzz words when you mention Advanced Analytics, including Data Science, Machine Learning, and Artificial Intelligence. They are all applications of data, but not techniques in themselves. I would start by asking questions about your business needs:
- If I get a large amount of Web Telemetry Data, can I enhance my E-Commerce Company?
- If I determine more information about my grocery store customers can I sell that information to manufacturers?
- Can I automate my Customer Service or other Customer Interactions?
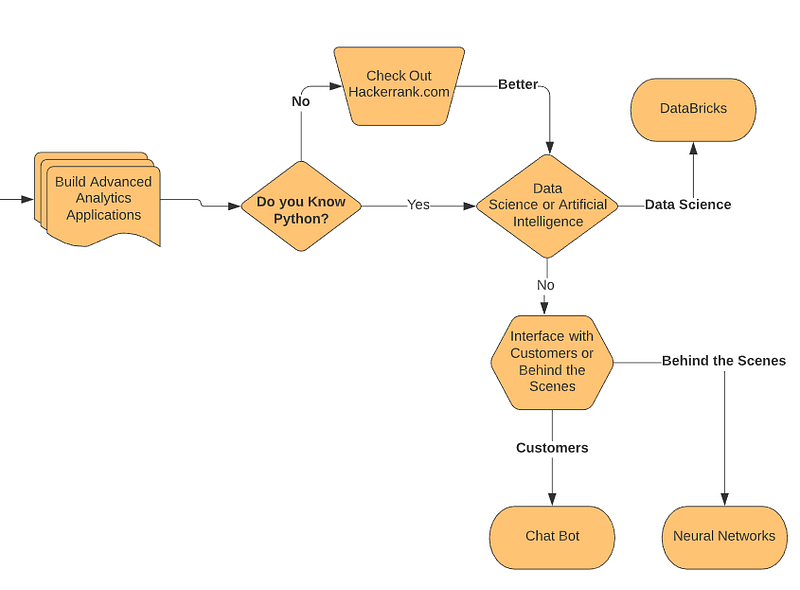
The Advanced Analytics discipline is consistently evolving. More and more SaaS companies are coming to market to help you automate this type of analysis. If you’re interested in this space, you should make sure that your Python Skills are up to snuff. If you are also interested in working for Enterprise sized companies, look at SasS Offerings like DataBricks, AWS Sagemaker, or TensorFlow.
Putting it all Together
The most important part of working in the Data and Analytics Space is constant learning. While each track we discussed has different skills and tools, they are all pieces of a single puzzle. The broader your experience, the more valuable you will become. So pick up a little SQL and a little Python. Build a “Full Stack” data ingestion from data ingestion to data visualization.
Your breadth will allow you to plan on what a project looks like and will illustrate when you need to deepen your experience with a skill. So go out there and learn!
Citations: