avatarBen Rogojan

Free AI web copilot to create summaries, insights and extended knowledge, download it at here

8184

Abstract

make sense)</li><li>Do we have the skills necessary to finish the data science project?</li><li>What are the data sets you are looking at?</li><li>Who will be using this tool?</li><li>How many people will be using the product?</li><li><a href="https://readmedium.com/operating-a-data-science-team-is-not-something-that-can-just-be-learned-by-watching-lectures-and-fef6ed0f714a">Do you currently know the ROI of this product?</a> (this might have to be researched by your team)</li><li>Can you list a few questions? let us know!</li></ul><h1 id="ce1f">3. Explore For Bias</h1><p id="d5a2">Before getting too far in setting up questions and designing metrics and dashboards. We like to look for bias and play with the data, just for a bit. Our team will time box a certain allotment of time, depending on the size of the data and complexity to just play essentially.</p><p id="b13a">This is the time when we look for bias, we look for missing data, we look for anything that could be strange.</p><p id="6a6e">This has several purposes.</p><p id="3af7">One, it helps line up possible questions we could develop for our analysis in the future.</p><p id="d46f">Two, if the data is bad, we figure that out as soon as possible. Sometimes bad data is easy to spot. If half the fields are Null, or if the numeric values have alpha characters, etc, etc. Well…</p><p id="7731">Time to go back to the drawing board and hope it isn’t as bad as it looks!</p><p id="751c">So how do you explore for bias and bad data?</p><p id="ef0c">Well here are some great first steps.</p><h2 id="507c">Import Your Libraries</h2> <figure id="b66f"> <div> <div>

            <iframe class="gist-iframe" src="/gist/dbaarchitech/880a30ad192681f608d4736e94848e7f.js" allowfullscreen="" frameborder="0" height="undefined" width="undefined">
          </div>
        </div>
    </figure></iframe></div></div></figure><h2 id="131b">Automation Add In:</h2><p id="73dc">Now, I am also going to add a bonus section here. <a href="http://www.acheronanalytics.com/acheron-blog/how-to-implement-data-science-automation">This has less to do with analytics and more to do with automation</a>. Remember how we had that quick one line script that pulled just the data types and and field names?</p><p id="9a56">What if you kept track of that meta data…in database! This is more for if you are planning to develop an entire system around the data set or have multiple data sets that are all very similar that need to constantly be processed.</p><p id="505d">My background was in data engineering so this is a trick you learn early on to help automate ETLs as well as analysis. Especially if you are getting similar files from multiple people with different field names that mean the same thing. Then you can remap easily, or load easily and do analysis based off of your standardized method vs their field names!</p>
    <figure id="964f">
        <div>
          <div>
            
            <iframe class="gist-iframe" src="/gist/dbaarchitech/63b6b32fad457c2afbf417a19edcea3f.js" allowfullscreen="" frameborder="0" height="undefined" width="undefined">
          </div>
        </div>
    </figure></iframe></div></div></figure><h2 id="4e45">“Pivot Tables”</h2>
    <figure id="00d6">
        <div>
          <div>
            
            <iframe class="gist-iframe" src="/gist/dbaarchitech/0d82babfe3d8897baecdbc8c4a36f095.js" allowfullscreen="" frameborder="0" height="undefined" width="undefined">
          </div>
        </div>
    </figure></iframe></div></div></figure><h2 id="3431">Histograms</h2>
    <figure id="b685">
        <div>
          <div>
            
            <iframe class="gist-iframe" src="/gist/dbaarchitech/ea2a534af1f257fbd46819917f9d23d8.js" allowfullscreen="" frameborder="0" height="undefined" width="undefined">
          </div>
        </div>
    </figure></iframe></div></div></figure><h2 id="d754">Correlation Matrix</h2>
    <figure id="e9dd">
        <div>
          <div>
            
            <iframe class="gist-iframe" src="/gist/dbaarchitech/2a80c8e8227618a9127cd73e18521a28.js" allowfullscreen="" frameborder="0" height="undefined" width="undefined">
          </div>
        </div>
    </figure></iframe></div></div></figure><h2 id="5d3d">What Conclusions Can Already Be Drawn?</h2><p id="0550">Well, we have only been exploring the data to look for anything that might stand out, both to help start lining up what possible questions we might have and also to examine the data for bias and bad data.</p><p id="eae4">Do you have any conclusions you can draw already?</p><p id="fd85">Notice anything in the histograms and <a href="http://www.sthda.com/english/wiki/correlation-matrix-a-quick-start-guide-to-analyze-format-and-visualize-a-correlation-matrix-using-r-software">correlation matrix</a>?</p><p id="5a08">We already discussed that we notice that the data is right leaning in the satisfaction level. This would make sense, because if a company was really so bad that the satisfaction level was in the middle and equally distributed from there. No one would work there.</p><p id="e4d7">Of course, it could just be a gaussian distribution spanning from .7 to 1. That might a little more sense.</p><p id="d60e">However, we say a clear group of people who were dissatisfied.</p><p id="5400">Next, look at the correlation matrix. What is correlated with what? One of the biggest correlations that jump out to me is between the “Left” field and “Satisfaction Level” field.</p><p id="a307">They are negatively correlated. This means, the lower the satisfaction level is, the closer the “Left” field is to 1 which translated to the person leaving.</p><p id="4a0d">Thus, one of the few variables that actually correlates with an employee leaving on its own is the “satisfaction_level”. You already have a lead!</p><p id="b0c8">Now, this is just that, a lead. From here, your team would have further questions!</p><p id="4af1">You would want to analyze the two different groups. Perhaps use the IQR to separate the employees with the lowest satisfaction..You could just pick a number that seemed right to you.</p><p id="4ce8">That doesn’t seem very scientific..</p><p id="e31d">Now, you could analyze both groups and compare traits!</p><ul><li>Are there events that lead up to an employee leaving? (Not getting a raise, passing an anniversary without a promotion, lack of interaction)</li><li>Do different types of employees (analysts vs. director) depict different traits before leaving</li><li>Does the rate of raises play a role in leaving</li><li>etc</li></ul><h2 id="f891">Count And Manage Nulls or Nans</h2><p id="053d">Currently, the data sets I am using as examples don’t have nulls. You can use the strip of code:</p><blockquote id="5b14"><p>“s.isnull().sum()”</p></blockquote><p id="c0d4">This is an easy way to see and track nulls.</p><p id="9560">That isn’t always the case. In fact, I recall a set of credit card data I once used that had nulls all over the place, income levels, spending rates, etc.</p><p id="0c2c">It was only about 10%-15% of the data. So we ended up finding the average per zip code for specific traits and replacing the nulls. Rather than excluding data.</p><p id="3b44">This is a educated guess of course. However, it is a great way to ensure as close to accurate data as possible.</p><h1 id="4db7">4. List out the questions you wish to answer</h1><p id="c0c5">We started to do this in the exploritoray phase of analysis. Let’s continue this discussion.</p><p id="d235">One important step, that can get easily missed because analysis has a way of dragging you down its rabbit hole is defining what questions your data team would like to answer.</p><p id="0629">It doesn’t matter whether the team is a team of data scientists, analysts, marketers, or business owners.</p><p id="829f">Without a set of questions, you could spend days spinning in circles with no real conclusions.</p><p id="01e6">Setting up questions is like setting goals. It helps you

Options

define what done is. Without it, you could be constantly getting into the data.</p><p id="c20b">That being said, each question answered, might lead to 3 new questions. This is fine and natural. It is also part of the process. Again, track these questions!</p><p id="7ce8">The purpose of this is not just to create goals, but also so when your team starts to walk through your notebook and finding with directors that it is easy for everyone to follow. Think of this more like a story book, just with data! Make sure you can re-trace your steps so you can re-explain your analysis.</p><h1 id="025a">5. Analyze the Data Set Using Different Methodologies</h1><p id="7131">With our new computing power. We are no longer limited to standard deviations, pivot tables and quintiles. Those are great measurements for analysis. However we now have a whole list of different algorithms and tools that can help us look at data.</p><p id="54e7">This includes<a href="http://www.datasciencecentral.com/profiles/blogs/40-techniques-used-by-data-scientists">, k-nn, support vector machines, boosting, bagging, and a cohort of other algorithms</a>.</p><p id="9702">Being that there are so many algorithms that can be drilled into. We are going to take several future sections devoted to applying these different algorithms to different data sets. To show how they can and could be used.</p><h1 id="1925">6. Contact SMEs(Subject Matter Experts) if necessary</h1><p id="877e">As data scientists, we don’t always know everything about different subject matters. Perhaps we have worked with healthcare data, but never accounting or e-commerce data.</p><p id="becd">In addition, each company houses their data slightly differently. Thus, it is important to address the problems by getting all the context possible.</p><p id="73da">This means going to the people who manage these processes. This might be <a href="http://www.itproportal.com/features/how-smes-can-benefit-from-data-science/">directors, or business owners</a> who are actually responsible for the processes which you are analyzing. They will have a great overview of the process which will help you as an analyst understand the data you are looking at.</p><p id="621f">For instance, we were recently talking to a travel reimbursement company developer who brought up the fact that they were having issues where their application logic was only inserting data into one of the two databases. This left one database out of sync. These errors happen all the time sadly. Yet, if you don’t actually go and talk to the developers and directors. It is like looking into a black box</p><p id="5928">Note to developers: Developers, please be honest and transparent with us when we come knocking looking for holes in the process. We are not trying to make you look bad…we just want to find out why the data is wrong. In meetings, we just call it a bug, we don’t want you getting in trouble either!</p><p id="7285">It is actually kind of fun once you are used to a system tracking down bugs(at least for me!). Personally, I like guessing what caused the data gap before even looking into the system. When you are right, it feels amazing, like King of the Lab amazing!</p><h1 id="d7e9">7. Peer Review Your Results</h1><p id="0db4">Mistakes happen, and bad assumptions can be made all the time with analysis. Sadly, unlike in programming where they are just bugs and are somewhat expected.</p><p id="2c86">Mistakes as an analysts or data scientists are just that, mistakes. One number off, and your entire analysis can be off.</p><p id="18e7"><a href="http://www.techrepublic.com/article/developers-guide-to-peer-reviews/">Thus, it is important to take step back on a regular </a>cadence<a href="http://www.techrepublic.com/article/developers-guide-to-peer-reviews/"> with each project and review the work being done. </a>This is also why it is great to keep a clear and concise notebook. That way, when you are presenting to your team. You can explain each detail easily.</p><p id="9390">The peer reviewer or reviewers should look for errors, formatting issues and ease of understanding. If your own team can’t understand what you are trying to say, it will be very difficult for a director who hasn’t been working with the data scientists closely to fully grasp the conclusions.</p><p id="0585">Our team, along with many other programmers and analysts like to say:</p><p id="c1ac">“ If you can’t explain it simply, you don’t understand it at all”</p><h1 id="bc93">8. Meet The Business or Product Owner Regularly</h1><p id="9ad7">Similar to the agile approach to programming. It is helpful to meet with the business owners and product managers of the project that is being worked on.</p><p id="a66d">In doing so, a data team becomes more attuned with the actual needs of the product as well as create increased ownership with the non-technical owners.</p><p id="32f8">There is a risk here too.</p><p id="59b2">Sometimes, this might lead to the business owners wanting lots of new features added as the product is still being developed as an MVP. A team will never finish the product in this state. Thus, it is important to meet regularly, but also keep in the original scope of the project.</p><h1 id="5f11">Summary</h1><p id="0cea">Data science and analytics is much like many other disciplines. It requires transparency and guidelines to avoid redundant work and ease of understanding. It can be easy as data people to think that everyone understands what we are talking about. However, business owners and product managers are often busy managing hundreds of employees, customers, or other variables.</p><p id="3fb6">Thus, it is up to us, the analyst to distill our process into a clear message.</p><h1 id="d220">What we will be discussing next:</h1><p id="7d88">This was merely an overview of the process of data analysis. We will be going more in depth with different data sets over the next few weeks. There will be a combination of examples and do it yourself problems that we encourage you to take on.</p><p id="5464">We will also be discussing applying other best business practices. Including how to setup automated data science systems, data engineering, etc.</p><p id="ba4d">If you also want to read more about basic applied statistics for business read the articles below:</p><p id="9de4"><a href="https://www.theseattledataguy.com/statistics-data-scientist-review/">Basic Statistics Every Data Science Should Know</a></p><p id="e5c0"><a href="https://www.theseattledataguy.com/data-science-case-studies/">How To Apply Statistics To Real Business Problems</a></p><p id="64e7"><a href="http://www.acheronanalytics.com/acheron-blog/brilliant-explanation-of-a-decision-tree-algorithms">Brilliant Decision Tree Examples</a></p> <figure id="6ed9"> <div> <div> <img class="ratio" src="http://placehold.it/16x9"> <iframe class="" src="https://cdn.embedly.com/widgets/media.html?src=https%3A%2F%2Fdocs.google.com%2Fforms%2Fd%2Fe%2F1FAIpQLScauoLPeWdFWIUUWL7PCz5QaSfCgZfG4_u0wuOdAdFzogiBFw%2Fviewform%3Fembedded%3Dtrue&amp;url=https%3A%2F%2Fdocs.google.com%2Fforms%2Fd%2Fe%2F1FAIpQLScauoLPeWdFWIUUWL7PCz5QaSfCgZfG4_u0wuOdAdFzogiBFw%2Fviewform%3Fusp%3Dsend_form&amp;image=https%3A%2F%2Flh3.googleusercontent.com%2FF61UyFSH-7Uy_hXtGu3i5X9xWXPSMfum_dgyYMQTCFIz8QdIo_MZFyB99REy2kwuZ0k%3Dw1200-h630-p&amp;key=a19fcc184b9711e1b4764040d3dc5c07&amp;type=text%2Fhtml&amp;schema=google" allowfullscreen="" frameborder="0" height="500" width="760"> </div> </div> </figure></iframe></div></div></figure><p id="20b0">Our team also offers training sessions for companies who want to help develop their employees analytical abilities. If you are interested in having analytical workshops and classes at your company please check out our <a href="https://www.theseattledataguy.com/data-strategy-consulting-science/">services here</a>! We would<a href="https://www.theseattledataguy.com/contact-data/"> love to discuss how our team can help develop your talent to increase their abilities and provided a much needed skill in the 21st century</a>.</p></article></body>

Intro To Data Analysis For Everyone, Part 2

In our last part we discussed the soft skills analysts needed to be a well rounded analysts or data scientists. We do hope you had a chance to read it as it lays out a great base layer for all your team members.

This next section will discuss the process of analysis in business. This will help a data science team and analysts improve communication and tractability of their work as well as increase speed and clarity.

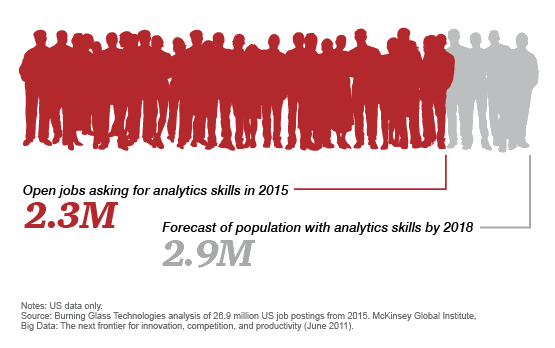
Important Update! : PwC recently published research depicting difficulty employers are facing to find strong data scientists, analysts and engineers.

Picture is from the PwC article linked above

We will be doing some quick snippets of code and notebooks. In this case, we will be using Jupyter Notebook. A lot of the work we are doing could also be done in Excel or R.

For those who haven’t used Jupyter notebook, here is a quick intro.

Data Science Guidelines

We would like to add that this section is focused on mapping out the process and we will be providing problems to work on and more specific walkthroughs in the next few sections.

Like most other disciplines (accounting, finance, operations, software development), data scientists should take a methodological approach at their work. The process we are laying out is in no way the only process, nor do we follow it to a T every time. However, it does make help increase speed and decrease errors by creating boundaries and goals that an individual analyst can meet.

Similar to many other processes, there is always wiggle room to adapt and add personal steps(like agile). Our team uses this process more like guidelines.

The Goal Of This Section

The goal at the end of analysis is that your data team can clearly communicate their ideas and that they can replicate their methodology. The in between is up to the data science team. Whatever makes them effective, is the goal, just don’t bs* yourself.

If you tell yourself you don’t need notes or comments, you are lying.

If you think formatting is not important…you’re kidding yourself.

If you think that other people are just not smart enough to get your analysis…remember..Einstein explained a much more complex processes in E=mc² and even middle schoolers understand that.

So if your analysis can’t be understood by executives with MBAs and 20 years of experience. It might not be them. It might be your analysis, even if what you have found out is brilliant and could save the company millions. It doesn’t matter if you can’t explain.

Your analysis must be understood by everyone!

The Process Of Data Analysis

1. Start a new notebook that is clearly labeled

We discussed in the first part, the key is being detail oriented. This requires being organized and making sure step one is setting up a new notebook.

This means, no setting up a notebook named “Untitled_V1”.

Make sure you have a clear name for your project. Some analysts and programmers like coming up with catchy names like “Cuttlefish”, “Jaberwoki” or some other strange but meaningful name.

We are going to name this Jupyter Notebook “Genesis”. Just to reference the beginning of some of your journeys into data analysis and data science!

In addition, write some quick notes about the purpose of the notebook, what is being used for, who has modified it, etc.

This will let analysts and data scientists who may stumble upon your data notebook 5 years from now the ability to understand it.

Then….set up some form of subversion. The last thing you want to play is, which work book is the one with the most recent updates.

2. Have a clear review meeting or kick off

This won’t really be able to be done by most of those following along with this step by step. However, it is a key point when designing a product, metric, dashboard, doing research, or designing a new data science tool for any other team or business owner or even your own team.

You need to have a meeting or two that helps the data team clearly understand the work they are about to take on. Reaching again, back to our first section. We discussed, empathetic listening in the part 1 of this series. Now is the time to turn that skill on!

Business and tech teams still speak pretty different languages. Thus, being bilingual in both languages is beneficial. A data scientists that can listen for more than just the hard engineering requirements is worth their weight in gold.

It is not a common skill. Sometimes, it can be easy to just get the requirements from a business team and close your ears to the actual context of the request.

Yet, that is where all the value add can come in! Building a product is great, and avoiding gold-plating is important!

However, that means you need to listen to and find out the actual business problem. This is difficult to simulate outside of a meeting…Actually, it can even be difficult in meetings.

This means asking good questions that show you understand the current topic, while at the same time, seeking out hidden nuggets of information.

Here are a few example questions that the data science team should be asking the product team:

  • Who has visibility into this project?
  • Do we already have a product like it?
  • Does our data science team need to be involved? Or can it be done by the engineering team? (Data science teams are often limited resources, and the projects need to make sense)
  • Do we have the skills necessary to finish the data science project?
  • What are the data sets you are looking at?
  • Who will be using this tool?
  • How many people will be using the product?
  • Do you currently know the ROI of this product? (this might have to be researched by your team)
  • Can you list a few questions? let us know!

3. Explore For Bias

Before getting too far in setting up questions and designing metrics and dashboards. We like to look for bias and play with the data, just for a bit. Our team will time box a certain allotment of time, depending on the size of the data and complexity to just play essentially.

This is the time when we look for bias, we look for missing data, we look for anything that could be strange.

This has several purposes.

One, it helps line up possible questions we could develop for our analysis in the future.

Two, if the data is bad, we figure that out as soon as possible. Sometimes bad data is easy to spot. If half the fields are Null, or if the numeric values have alpha characters, etc, etc. Well…

Time to go back to the drawing board and hope it isn’t as bad as it looks!

So how do you explore for bias and bad data?

Well here are some great first steps.

Import Your Libraries

Automation Add In:

Now, I am also going to add a bonus section here. This has less to do with analytics and more to do with automation. Remember how we had that quick one line script that pulled just the data types and and field names?

What if you kept track of that meta data…in database! This is more for if you are planning to develop an entire system around the data set or have multiple data sets that are all very similar that need to constantly be processed.

My background was in data engineering so this is a trick you learn early on to help automate ETLs as well as analysis. Especially if you are getting similar files from multiple people with different field names that mean the same thing. Then you can remap easily, or load easily and do analysis based off of your standardized method vs their field names!

“Pivot Tables”

Histograms

Correlation Matrix

What Conclusions Can Already Be Drawn?

Well, we have only been exploring the data to look for anything that might stand out, both to help start lining up what possible questions we might have and also to examine the data for bias and bad data.

Do you have any conclusions you can draw already?

Notice anything in the histograms and correlation matrix?

We already discussed that we notice that the data is right leaning in the satisfaction level. This would make sense, because if a company was really so bad that the satisfaction level was in the middle and equally distributed from there. No one would work there.

Of course, it could just be a gaussian distribution spanning from .7 to 1. That might a little more sense.

However, we say a clear group of people who were dissatisfied.

Next, look at the correlation matrix. What is correlated with what? One of the biggest correlations that jump out to me is between the “Left” field and “Satisfaction Level” field.

They are negatively correlated. This means, the lower the satisfaction level is, the closer the “Left” field is to 1 which translated to the person leaving.

Thus, one of the few variables that actually correlates with an employee leaving on its own is the “satisfaction_level”. You already have a lead!

Now, this is just that, a lead. From here, your team would have further questions!

You would want to analyze the two different groups. Perhaps use the IQR to separate the employees with the lowest satisfaction..You could just pick a number that seemed right to you.

That doesn’t seem very scientific..

Now, you could analyze both groups and compare traits!

  • Are there events that lead up to an employee leaving? (Not getting a raise, passing an anniversary without a promotion, lack of interaction)
  • Do different types of employees (analysts vs. director) depict different traits before leaving
  • Does the rate of raises play a role in leaving
  • etc

Count And Manage Nulls or Nans

Currently, the data sets I am using as examples don’t have nulls. You can use the strip of code:

“s.isnull().sum()”

This is an easy way to see and track nulls.

That isn’t always the case. In fact, I recall a set of credit card data I once used that had nulls all over the place, income levels, spending rates, etc.

It was only about 10%-15% of the data. So we ended up finding the average per zip code for specific traits and replacing the nulls. Rather than excluding data.

This is a educated guess of course. However, it is a great way to ensure as close to accurate data as possible.

4. List out the questions you wish to answer

We started to do this in the exploritoray phase of analysis. Let’s continue this discussion.

One important step, that can get easily missed because analysis has a way of dragging you down its rabbit hole is defining what questions your data team would like to answer.

It doesn’t matter whether the team is a team of data scientists, analysts, marketers, or business owners.

Without a set of questions, you could spend days spinning in circles with no real conclusions.

Setting up questions is like setting goals. It helps you define what done is. Without it, you could be constantly getting into the data.

That being said, each question answered, might lead to 3 new questions. This is fine and natural. It is also part of the process. Again, track these questions!

The purpose of this is not just to create goals, but also so when your team starts to walk through your notebook and finding with directors that it is easy for everyone to follow. Think of this more like a story book, just with data! Make sure you can re-trace your steps so you can re-explain your analysis.

5. Analyze the Data Set Using Different Methodologies

With our new computing power. We are no longer limited to standard deviations, pivot tables and quintiles. Those are great measurements for analysis. However we now have a whole list of different algorithms and tools that can help us look at data.

This includes, k-nn, support vector machines, boosting, bagging, and a cohort of other algorithms.

Being that there are so many algorithms that can be drilled into. We are going to take several future sections devoted to applying these different algorithms to different data sets. To show how they can and could be used.

6. Contact SMEs(Subject Matter Experts) if necessary

As data scientists, we don’t always know everything about different subject matters. Perhaps we have worked with healthcare data, but never accounting or e-commerce data.

In addition, each company houses their data slightly differently. Thus, it is important to address the problems by getting all the context possible.

This means going to the people who manage these processes. This might be directors, or business owners who are actually responsible for the processes which you are analyzing. They will have a great overview of the process which will help you as an analyst understand the data you are looking at.

For instance, we were recently talking to a travel reimbursement company developer who brought up the fact that they were having issues where their application logic was only inserting data into one of the two databases. This left one database out of sync. These errors happen all the time sadly. Yet, if you don’t actually go and talk to the developers and directors. It is like looking into a black box

Note to developers: Developers, please be honest and transparent with us when we come knocking looking for holes in the process. We are not trying to make you look bad…we just want to find out why the data is wrong. In meetings, we just call it a bug, we don’t want you getting in trouble either!

It is actually kind of fun once you are used to a system tracking down bugs(at least for me!). Personally, I like guessing what caused the data gap before even looking into the system. When you are right, it feels amazing, like King of the Lab amazing!

7. Peer Review Your Results

Mistakes happen, and bad assumptions can be made all the time with analysis. Sadly, unlike in programming where they are just bugs and are somewhat expected.

Mistakes as an analysts or data scientists are just that, mistakes. One number off, and your entire analysis can be off.

Thus, it is important to take step back on a regular cadence with each project and review the work being done. This is also why it is great to keep a clear and concise notebook. That way, when you are presenting to your team. You can explain each detail easily.

The peer reviewer or reviewers should look for errors, formatting issues and ease of understanding. If your own team can’t understand what you are trying to say, it will be very difficult for a director who hasn’t been working with the data scientists closely to fully grasp the conclusions.

Our team, along with many other programmers and analysts like to say:

“ If you can’t explain it simply, you don’t understand it at all”

8. Meet The Business or Product Owner Regularly

Similar to the agile approach to programming. It is helpful to meet with the business owners and product managers of the project that is being worked on.

In doing so, a data team becomes more attuned with the actual needs of the product as well as create increased ownership with the non-technical owners.

There is a risk here too.

Sometimes, this might lead to the business owners wanting lots of new features added as the product is still being developed as an MVP. A team will never finish the product in this state. Thus, it is important to meet regularly, but also keep in the original scope of the project.

Summary

Data science and analytics is much like many other disciplines. It requires transparency and guidelines to avoid redundant work and ease of understanding. It can be easy as data people to think that everyone understands what we are talking about. However, business owners and product managers are often busy managing hundreds of employees, customers, or other variables.

Thus, it is up to us, the analyst to distill our process into a clear message.

What we will be discussing next:

This was merely an overview of the process of data analysis. We will be going more in depth with different data sets over the next few weeks. There will be a combination of examples and do it yourself problems that we encourage you to take on.

We will also be discussing applying other best business practices. Including how to setup automated data science systems, data engineering, etc.

If you also want to read more about basic applied statistics for business read the articles below:

Basic Statistics Every Data Science Should Know

How To Apply Statistics To Real Business Problems

Brilliant Decision Tree Examples

Our team also offers training sessions for companies who want to help develop their employees analytical abilities. If you are interested in having analytical workshops and classes at your company please check out our services here! We would love to discuss how our team can help develop your talent to increase their abilities and provided a much needed skill in the 21st century.

Data Science
Analytics
Python
Project Management
Statistics
Recommended from ReadMedium