
Dashboards in Python for Beginners using Dash — Exporting Data from a Dashboard
Learn Techniques to Build Professional Dashboards using Python

Everyone Wants Data!
As a Product Analyst on a Data Science team, I have a lot of data at my finger tips and people want me to help them gain insight from it. I’ve been using Dash to create dashboards for our business teams because it enables me to quickly prototype and share visualizations, data tables, and other dashboardy things. Once you understand the patterns of the framework, it is easy to code a dashboard and get it up and running in an afternoon. I like using Dash because it gives me an opportunity to practice Python while building something that delivers insight to the people who need it. Even though I try to include all the information they want, one of the features people always request is the ability to export data from the dashboard.
How can I export data from a Dash app?
Dash doesn’t yet have a core component for that, so I scoured the community forums and came up with a solution that works well for small and large datasets!
Dash Refresher
Dash is an open source framework for Python written on top of Flask, Plotly.js, and React.js. If you’re completely new to Dash and want to learn the core concepts, check out my Intro tutorials. Below I provide a brief Dash refresher, and I include all needed code in this article for those who are already familiar with Dash core concepts.
Intro to Dash for Beginners and Everyone Else Styling Dash DataTables and Extracting Data from Reddit
Dash apps are composed of Layouts and Callbacks:
Layout
The layout is made up of a tree of components that describe what the application looks like and how users experience the content.
Callbacks
Callbacks make the Dash apps interactive. Callbacks use Inputs and Outputs, and are Python functions that are automatically called whenever an input property changes.
Necessary Installations
Run these pip install commands to make sure you have the correct libraries:
pip install pandas
pip install dash
pip install dash-bootstrap-components
pip install plotly
The File Structure
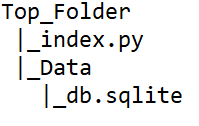
The file structure for this Dash app example is simple. It consists of our Dash app as index.py and a data file stored in the Data folder:
Creating the Dash App
Before setting up the extract feature, I want end users to be able to filter the data. To accomplish that, I’m going to use the Dash Data Table component library to create a filterable data table. The DataTable component is an interactive table designed for exploring large datasets. It is easy to style because it is rendered with standard HTML, and it uses React.js under the hood making it highly customizable.
Import Dependencies
I import all my dependencies at the beginning of the file. Notice urllib is imported. That library will be used to create the export button!
import dash
import dash_html_components as html
import dash_core_components as dcc
import dash_table
import pandas as pd
import urllib
from dash.dependencies import Input, Output, State
Import the Data
I am using the wine review dataset from Kaggle. I have already cleaned the data and saved it to a sqlite3 database. I cover the data transformations in a previous article, or find the dataset on my github.
#establish the connection to the database
conn = sqlite3.connect("Data\wine_data.sqlite")
c = conn.cursor()
#load the data into a pandas dataframe
df = pd.read_sql("select * from wine_data", conn)#include the desired columns only
df = df[['country', 'description', 'rating', 'price','province','title','variety','winery','color']]#display the first row of the dataframe
df.head(1)I establish a connection to the sqlite database, wine_data, and then read the data into a dataframe using pandas read_sql() feature. I then set the dataframe columns to include only the ones in which I’m interested.
Instantiate the Dash App
Create an instance of the dash app. I’ll fill out the layout and add call backs in between these two bits of code:
#instantiate the dash app
app = dash.Dash(__name__)
<Layout and callbacks go here>if __name__ == '__main__':
app.run_server(debug=True)Construct the Layout for a Data Table
The layout will consist of a Data Table and an Export Button. The data table can be filtered and sorted by multiple columns at the same time. To do this, I am using a lot of boiler plate code available in the Dash DataTable documentation. I’ll walk through each piece of the data table code before adding the Export button.
Data Table
As is common practice, I wrap the DataTable in an html.Div component. This data table makes use of backend paging so it doesn’t try loading all the results at once and overload the page. I set the PAGE_SIZE to 200 which means 200 results display per page. Feel free to adjust PAGE_SIZE, maxHeight values as needed for your screen size.
#set the page size
PAGE_SIZE = 200#build the app layout
app.layout = html.Div([
dash_table.DataTable(
id='table-sorting-filtering',
style_data={
'whiteSpace': 'normal',
'height': 'auto'
},
style_table={
'maxHeight': '800px'
,'overflowY': 'scroll'
},
columns=[
{'name': i, 'id': i} for i in df.columns
],
page_current= 0,
page_size= PAGE_SIZE,
page_action='custom', filter_action='custom',
filter_query='', sort_action='custom',
sort_mode='multi',
sort_by=[]
)
])# end divNotice I have applied some styling to the data table using style_data and style_table. That is to make the data table look nicer than the default settings, and to limit the amount of space it consumes on the page. This technique is useful if you want to include additional items on the page, like graphs.
Notice I set the filter_query=’’. The query will be updated based on user input and filtering will be applied using a function and a callback outside of the layout.
Filtering Data Table Data
To filter the data, a query is constructed using the DataTable Filter syntax. The user doesn’t need to know the syntax. Instead, I’ll construct a list of operators and a function to convert the common symbols to the syntax equivalents.
Filtering Operators
Use the letters instead of the corresponding symbol.
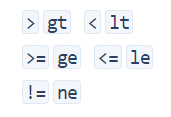
Simply create a list of the operators to be used in the filtering function:
operators = [['ge ', '>='],
['le ', '<='],
['lt ', '<'],
['gt ', '>'],
['ne ', '!='],
['eq ', '='],
['contains '],
['datestartswith ']]Filtering Function
The function split_filter_part, combined with the list of operators, makes it so the end users don’t need to know the DataTable filtering syntax. They can use the symbols like <, >, =…etc, with which they are already comfortable. This function can be found in the DataTable documentation.
def split_filter_part(filter_part):
for operator_type in operators:
for operator in operator_type:
if operator in filter_part:
name_part, value_part = filter_part.split(operator, 1)
name = name_part[name_part.find('{') + 1: name_part.rfind('}')]value_part = value_part.strip()
v0 = value_part[0]
if (v0 == value_part[-1] and v0 in ("'", '"', '`')):
value = value_part[1: -1].replace('\\' + v0, v0)
else:
try:
value = float(value_part)
except ValueError:
value = value_part# word operators need spaces after them in the filter string,
# but we don't want these later
return name, operator_type[0].strip(), valuereturn [None] * 3Filtering Callback
The final piece in making the sorting and filtering work is the callback. The callback consists of logic to sort the data and filter the data based on the filter query. Callbacks take Input and produce Output. The inputs will be the DataTable componentID paired with parameters. The output will be the data. The DataTable componentID is table-sorting-filtering.
@app.callback(
Output('table-sorting-filtering', 'data'),
[Input('table-sorting-filtering', "page_current"),
Input('table-sorting-filtering', "page_size"),
Input('table-sorting-filtering', 'sort_by'),
Input('table-sorting-filtering', 'filter_query')])
def update_table(page_current, page_size, sort_by, filter):
filtering_expressions = filter.split(' && ')
dff = df
for filter_part in filtering_expressions:
col_name, operator, filter_value = split_filter_part(filter_part)if operator in ('eq', 'ne', 'lt', 'le', 'gt', 'ge'):
# these operators match pandas series operator method names
dff = dff.loc[getattr(dff[col_name], operator)(filter_value)]
elif operator == 'contains':
dff = dff.loc[dff[col_name].str.contains(filter_value)]
elif operator == 'datestartswith':
# this is a simplification of the front-end filtering logic,
# only works with complete fields in standard format
dff = dff.loc[dff[col_name].str.startswith(filter_value)]if len(sort_by):
dff = dff.sort_values(
[col['column_id'] for col in sort_by],
ascending=[
col['direction'] == 'asc'
for col in sort_by
],
inplace=False
)page = page_current
size = page_size
return dff.iloc[page * size: (page + 1) * size].to_dict('records')Notice the callback function uses pandas iloc[] and a formula to return the correct page. The callback is primarily logic that breaks down the query and produces the filtered result set.
Extracting Data as CSV
Dash doesn’t yet have a simple Download component, but the community has devised multiple ways to do it. I’m adopting one of the methods for this use-case since it works well on large and small data. This is the community answer for exporting large data sets.
Create a Download Link
Using the html.A component, a download link can be created. It is typically used to create a link with its href attribute. In this case, it is being used to download data.csv through an href value output by a callback.
html.A('Download CSV', id='my-link', download="data.csv",
href="",
target="_blank")The html.A component can come before or after the data table in the layout. In the example, I put the link at the bottom of the page, so the layout component tree is essentially this:
layout = html.Div ([data_table() , html.A()])
Create an Export Callback
Exporting the filtered data table requires a callback. Since the data exported should match the data displayed in the data table, simply reuse the data table callback and make a few adjustments. The bold text is what was changed from the copied callback. Change the output value, the function name, and return the csv file using pandas and urllib.
@app.callback(Output('my-link', 'href')
, [Input('table-sorting-filtering', "page_current"),
Input('table-sorting-filtering', "page_size"),
Input('table-sorting-filtering', 'sort_by'),
Input('table-sorting-filtering', 'filter_query')])
def update_table2(page_current, page_size, sort_by, filter):
filtering_expressions = filter.split(' && ')
dff = df
for filter_part in filtering_expressions:
col_name, operator, filter_value = functions.split_filter_part(filter_part)if operator in ('eq', 'ne', 'lt', 'le', 'gt', 'ge'):
# these operators match pandas series operator method names
dff = dff.loc[getattr(dff[col_name], operator)(filter_value)]
elif operator == 'contains':
dff = dff.loc[dff[col_name].str.contains(filter_value)]
elif operator == 'datestartswith':
# this is a simplification of the front-end filtering logic,
# only works with complete fields in standard format
dff = dff.loc[dff[col_name].str.startswith(filter_value)]if len(sort_by):
dff = dff.sort_values(
[col['column_id'] for col in sort_by],
ascending=[
col['direction'] == 'asc'
for col in sort_by
],
inplace=False
)csv_string = dff.to_csv(index=False, encoding='utf-8')
csv_string = "data:text/csv;charset=utf-8,%EF%BB%BF" + urllib.parse.quote(csv_string)
return csv_stringNotice the inputs are the standard filtering template, and the output is for the component ID my-link which was used with html.A. The dataframe gets filtered and cast to a csv file using pandas. Then urllib is used to parse the link string, and the csv_string is returned.
The Complete Code
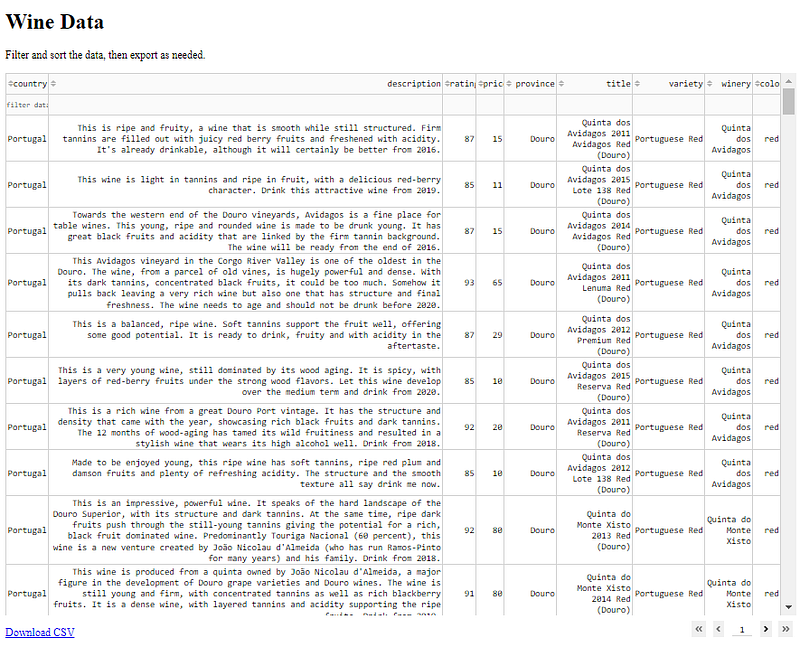
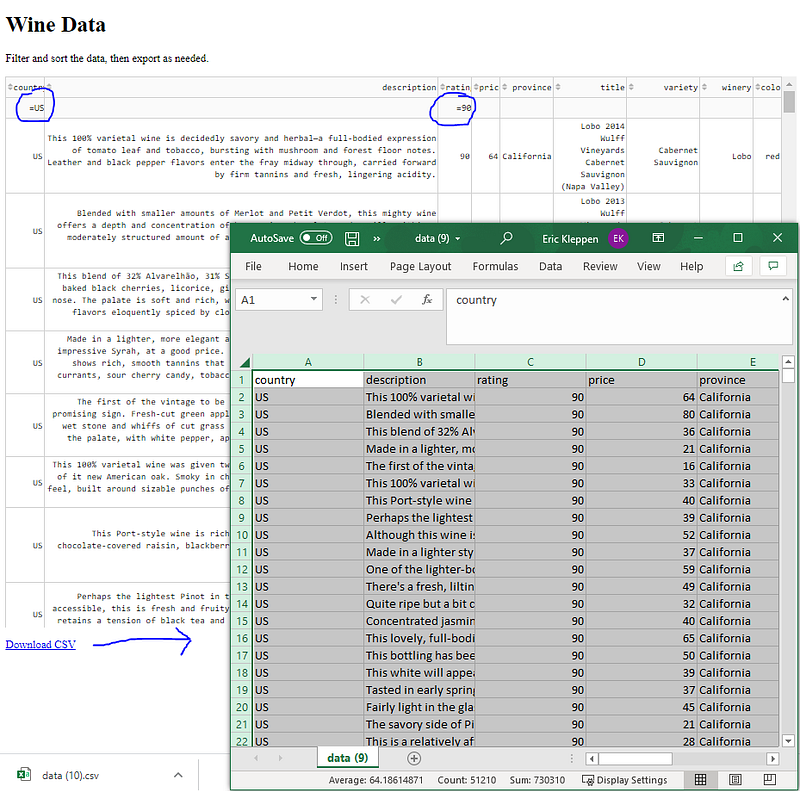
Because not everyone understands query languages or has permission to view source data, it is important to know how to share data in a way that allows people to manipulate it and do their own investigations and analysis. Below is the complete code so anyone can copy, paste and play around with the dashboard. It can also be found on my Github. When the Download CSV button is clicked, the filtered data table exports!
The Code
Find this code and more in my github!
import dash
import dash_html_components as html
import dash_core_components as dcc
import dash_table
import pandas as pd
import sqlite3
from dash.dependencies import Input, Output, State
import urllib#establish the connection to the database
conn = sqlite3.connect("Data\wine_data.sqlite")
c = conn.cursor()#load the data into a pandas dataframe
df = pd.read_sql("select * from wine_data", conn)#include the desired columns only
df = df[['country', 'description', 'rating', 'price','province','title','variety','winery','color']]#display the first row of the dataframe
df.head(1)#instantiate the dash app
app = dash.Dash(__name__)PAGE_SIZE = 200#build the app layout
app.layout = html.Div([
html.H1("Wine Data"),
html.P(''),
html.P('Filter and sort the data, then export as needed.'),
html.P(''),
dash_table.DataTable(
id='table-sorting-filtering',
style_data={
'whiteSpace': 'normal',
'height': 'auto'
},
style_table={
'maxHeight': '800px'
,'overflowY': 'scroll'
},
columns=[
{'name': i, 'id': i} for i in df.columns
],
page_current= 0,
page_size= PAGE_SIZE,
page_action='custom',filter_action='custom',
filter_query='',sort_action='custom',
sort_mode='multi',
sort_by=[]
)
, html.Div([ html.P(' ')
,html.A('Download CSV', id='my-link', download="data.csv",
href="",
target="_blank")
])
])# end div#list of operators for data table query
operators = [['ge ', '>='],
['le ', '<='],
['lt ', '<'],
['gt ', '>'],
['ne ', '!='],
['eq ', '='],
['contains '],
['datestartswith ']]def split_filter_part(filter_part):
for operator_type in operators:
for operator in operator_type:
if operator in filter_part:
name_part, value_part = filter_part.split(operator, 1)
name = name_part[name_part.find('{') + 1: name_part.rfind('}')]value_part = value_part.strip()
v0 = value_part[0]
if (v0 == value_part[-1] and v0 in ("'", '"', '`')):
value = value_part[1: -1].replace('\\' + v0, v0)
else:
try:
value = float(value_part)
except ValueError:
value = value_part# word operators need spaces after them in the filter string,
# but we don't want these later
return name, operator_type[0].strip(), valuereturn [None] * 3#call back to sort and filter data table
@app.callback(
Output('table-sorting-filtering', 'data'),
[Input('table-sorting-filtering', "page_current"),
Input('table-sorting-filtering', "page_size"),
Input('table-sorting-filtering', 'sort_by'),
Input('table-sorting-filtering', 'filter_query')])
def update_table(page_current, page_size, sort_by, filter):
filtering_expressions = filter.split(' && ')
dff = df
for filter_part in filtering_expressions:
col_name, operator, filter_value = split_filter_part(filter_part)if operator in ('eq', 'ne', 'lt', 'le', 'gt', 'ge'):
# these operators match pandas series operator method names
dff = dff.loc[getattr(dff[col_name], operator)(filter_value)]
elif operator == 'contains':
dff = dff.loc[dff[col_name].str.contains(filter_value)]
elif operator == 'datestartswith':
# this is a simplification of the front-end filtering logic,
# only works with complete fields in standard format
dff = dff.loc[dff[col_name].str.startswith(filter_value)]if len(sort_by):
dff = dff.sort_values(
[col['column_id'] for col in sort_by],
ascending=[
col['direction'] == 'asc'
for col in sort_by
],
inplace=False
)page = page_current
size = page_size
return dff.iloc[page * size: (page + 1) * size].to_dict('records')#callback to filter and sort data for export link
@app.callback(Output('my-link', 'href')
, [Input('table-sorting-filtering', "page_current"),
Input('table-sorting-filtering', "page_size"),
Input('table-sorting-filtering', 'sort_by'),
Input('table-sorting-filtering', 'filter_query')])
def update_table2(page_current, page_size, sort_by, filter):
filtering_expressions = filter.split(' && ')
dff = df
for filter_part in filtering_expressions:
col_name, operator, filter_value = split_filter_part(filter_part)
if operator in ('eq', 'ne', 'lt', 'le', 'gt', 'ge'):
# these operators match pandas series operator method names
dff = dff.loc[getattr(dff[col_name], operator)(filter_value)]
elif operator == 'contains':
dff = dff.loc[dff[col_name].str.contains(filter_value)]
elif operator == 'datestartswith':
# this is a simplification of the front-end filtering logic,
# only works with complete fields in standard format
dff = dff.loc[dff[col_name].str.startswith(filter_value)]
if len(sort_by):
dff = dff.sort_values(
[col['column_id'] for col in sort_by],
ascending=[
col['direction'] == 'asc'
for col in sort_by
],
inplace=False
)
csv_string = dff.to_csv(index=False, encoding='utf-8')
csv_string = "data:text/csv;charset=utf-8,%EF%BB%BF" + urllib.parse.quote(csv_string)
return csv_string#used for instantiating the app
if __name__ == '__main__':
app.run_server(debug=True)Thank You!
- If you enjoyed this, follow me on Medium for more
- Get FULL ACCESS and help support my content by subscribing
- Let’s connect on LinkedIn
- Analyze Data using Python? Check out my website


